How to use the MACD (Moving Average Converge /divergence) Indicator?

Forex trading is all about identifying and analyzing the market trends. This is precisely why traders use a wide variety of trading tools and technical indicators for gauging the latest market trends including bearish and bullish movements. One of the most commonly used technical tools is MACD or Moving Average Convergence Divergence. Here, learn more about MACD indicator and how to use it for effective or successful trading.
Moving Average (MACD) Indicator
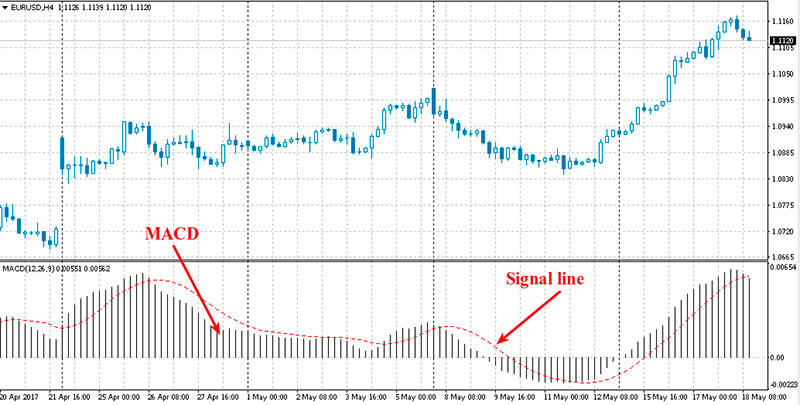
Designed by Gerald Appel during the seventies, the MACD indicator is an easy to use and highly effective movement indicator. The Moving Average Convergence Divergence basically offers signals around momentum as well as trends. The MACD keeps fluctuating below and above as and when the moving averages cross, diverge and converge during a given period. As a result, traders need to watch out for trading signals such as centerline crossovers, divergences and crossover in order to produce signals. Since the MACD chart is not bounded, it isn’t useful when it comes to assessing oversold and overbought levels.
The MACD chart basically represents three different numbers, which are used by traders for setting the same. While, the 1st number represents the number of periods, which in turn is used for calculating the fast moving average, the 2nd number is the number of periods that is used for calculating slow moving average. The 3rd number indicates the number of bars.
As already stated above, the MACD revolves around the divergence and convergence of two different moving averages. Convergence takes place when moving averages come together and divergence takes place when the moving averages shift away from one another. The short moving average i.e. 12 day is much faster and causes much of the MACD up and down movements. The long moving average i.e. 26 day is slow and hence does not react in accordance with the changes in prices of the asset.
The Moving Average line continues to oscillate below and above the zero line, which is also referred to as the centerline. These particular crossovers indicate that 12 day Exponential Moving Average (EMA) has surpassed the twenty six day EMA. This direction, however, is dependent on the course of the moving average cross. When the MACD is positive, it implies that the 12 day EMA has gone over and above the 26 day exponential moving average. This also indicates that the market is witnessing a positive momentum. On the other hand, when the negative value increases, the shorter exponential moving average has diverged further to move under the longer exponential moving average. As a result, this gives rise to a downward momentum.
Signal Line Crossovers
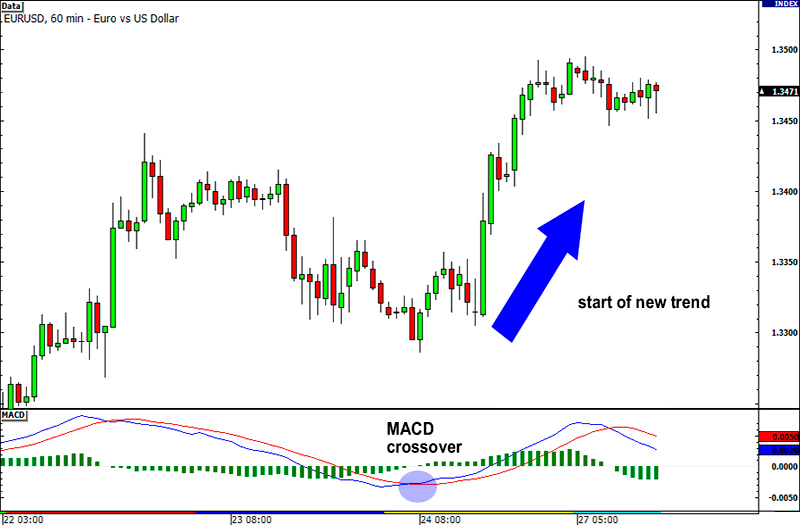
The signal line crossover is a popular MACD signal. This is basically a 9 day exponential moving average in the Moving Average Convergence Divergence line. It enables the traders to gauge the MACD changes and turns. The crossover is bullish when MACD goes up as well as goes beyond the signal line. On the other hand, the crossover is bearish when MACD goes down as well as goes beyond the signal line. Depending upon the weakness and strength of a market movement, crossovers could last for a couple of days or weeks. Traders must do enough analysis and calculations before trusting these signals. In fact, they must view the positive and negative signal line crossovers with a great deal of caution. Despite the fact that the MACD doesn’t have any lower and upper limits, chart readers can assess the historically extreme movements by simply viewing the MACD charts. Traders must know that only a very strong market movement of the asset can push the momentum to its extreme. Apart from this, volatility may also result in increased crossovers.
Centerline Crossovers
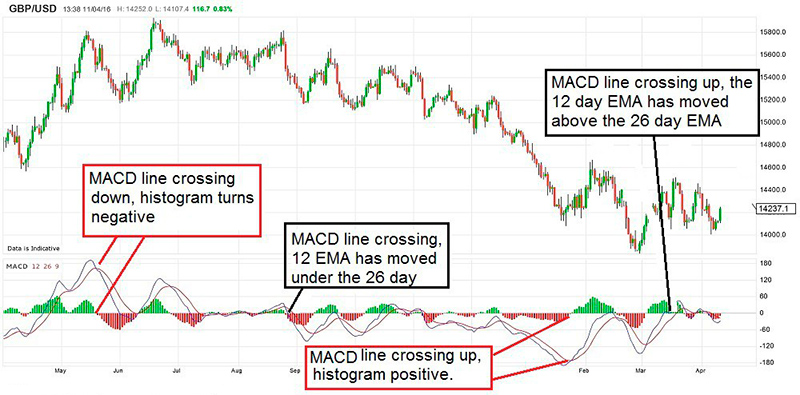
The centerline crossovers are also common in MACD indicators. Centerline crossovers are bullish when MACD line goes beyond the zero line and becomes positive. This takes place only after the twelve day exponential moving average of the asset goes beyond the twenty six day exponential moving average. On the other hand, the centerline crossover is bearish when MACD goes under the zero line and becomes negative. This occurs when twelve day exponential moving average goes below the twenty six day exponential moving average. The centerline crossovers could last for a couple of months or day, depending upon the trend’s strength. As a result, the Moving Average Convergence Divergence will show positive momentum till the time the uptrend sustains. On the contrary, it shall show negative momentum till the time the downtrend sustains.
Divergences
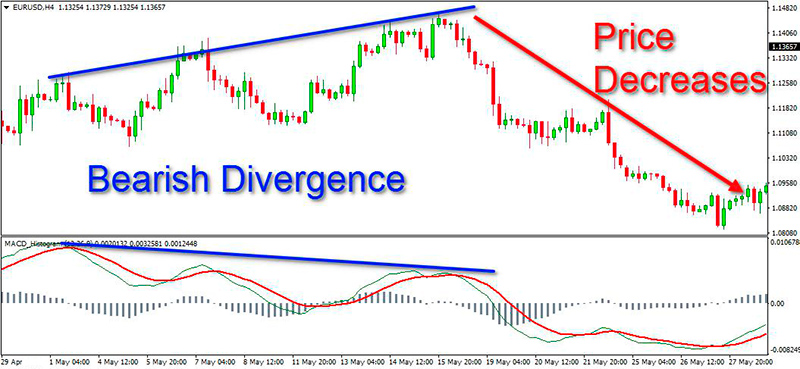
Divergences occur when there is divergence in the price of the asset, in the Moving Average Convergence Divergence indicator. The divergence is bullish in nature when the asset registers a lower low as well as the MACD indicator forms a higher low level. Similarly, the divergence is bearish in nature when the asset registers a higher high whereas the MACD indicator records a lower upside movement. Again, like every other trend, traders should exercise caution at the time of taking divergences into consideration. Bearish divergence is common during a strong upward movement or uptrend. The bullish divergence is common during a strong downward movement or downtrend.
Conclusion
The Moving Average Convergence Divergence indicator is important as it brings both the trend as well as market momentum together in an indicator. This combination of momentum as well as trend is applicable to weekly, monthly and daily charts. Traders can opt for the most basic MACD setting wherein it reflects the difference between twelve and twenty six days exponential moving averages.
Also, the Moving Average Convergence Divergence indicator may not be suitable for assessing the market oversold or overbought levels. Despite the fact that traders can use the MACD for assessing the historically oversold and overbought levels, it doesn’t feature any lower or upper limits that’ll keep it bounded. During sharp market movements, the indicator could continue to move beyond the extreme levels recorded historically. Last but not the least traders must also understand that when it comes to calculating the MACD line, they need to use the differences between two different moving averages. This implies that the values of MACD are based on the asset pricing. Traders can set the MACD indicator below, behind or above the asset’s price. Hence, when they place the MACD behind the asset price, they find it easier to compare the momentum moves with the price moves. After a trader selects the MACD indicators, the default settings appear as 12, 26 and 9. Traders can later adjust and increase or decrease the sensitivity, depending upon their trading strategy and style. Apart from this, the Moving Average Convergence Divergence Histogram also appears alongside the indicator and can also be used separately.