What is Support and Resistance in the forex market?
 The foreign exchange market is an ever expanding financial marketplace that allows traders to access global as well as leading forex markets around the globe. However, when it comes to trading, traders are almost always concerned about the support as well as resistance levels. While, support and resistance or not any exact figures, it is impertinent for traders to understand the concept behind support as well as resistance for placing safe and successful trades. Read on to find out what are support and resistance levels and their relevance in the world of forex.
Introduction
Traders, irrespective of whether they are beginners, intermediate or highly experienced, are always advised to purchase low and sell at higher levels. However, they are never too sure how low or high they need to actually sell. This is precisely why they must comprehend the concept of support and resistance as well as technical forex indicator. In fact, appropriate knowledge and understanding of support and resistance levels as well as technical indicators enable traders in formulating effective trading plans as well as strategies. For instance, when traders have been holding on to a stock/asset, which is nearing resistance level, they may choose to close their positions instead of waiting for the profits to decline in case there is a reverse in the uptrend. Apart from this, traders also need to keep a track of the stock exchanges including nifty, BSE and NSE etc. as it further helps them in monitoring the stock price movements and arrive at an appropriate investment decision.
Support and Resistance Explained
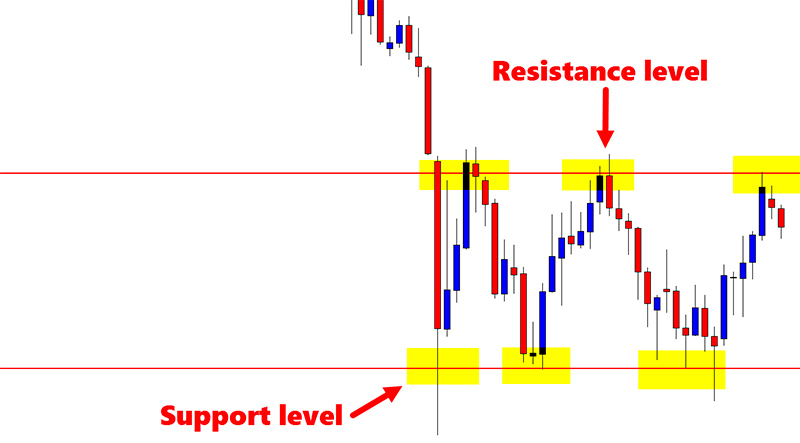
Simply put, support also referred to as support level is essentially that level or price of a stock which has never gone below a certain level. In fact, when the price of stock faces difficulty in falling below a certain level and the buyers choose to enter or buy it, then it is certainly the case of support in forex. This support is further confirmed when buyers purchase more of that stock, resulting in a further rise. Thus, when the price of the stock goes beyond the level of support, it implies that particular support level has failed and the market is searching for a fresh one.
Resistance, on the other hand, is the area where the price of the stock begins to turn. This is not just any random spot where the price begins to turn around automatically. Resistance level is also referred to ceiling, as this price level prevents the forex market from pushing the price upwards. There may be traders who may have purchased near or at resistance level and are therefore stuck in that position. As a result, these investors are desperately waiting for the price to rise at least once in order to breakeven. Resistance is caused as a result of an oversupply of the stock, especially when institutional investors choose to liquidate a huge position at a specific price. Till the time the market absorbs that large selling order, the stock price shall continue to hover at that specific level itself, which further creates a resistance level.
Importance of Trendlines
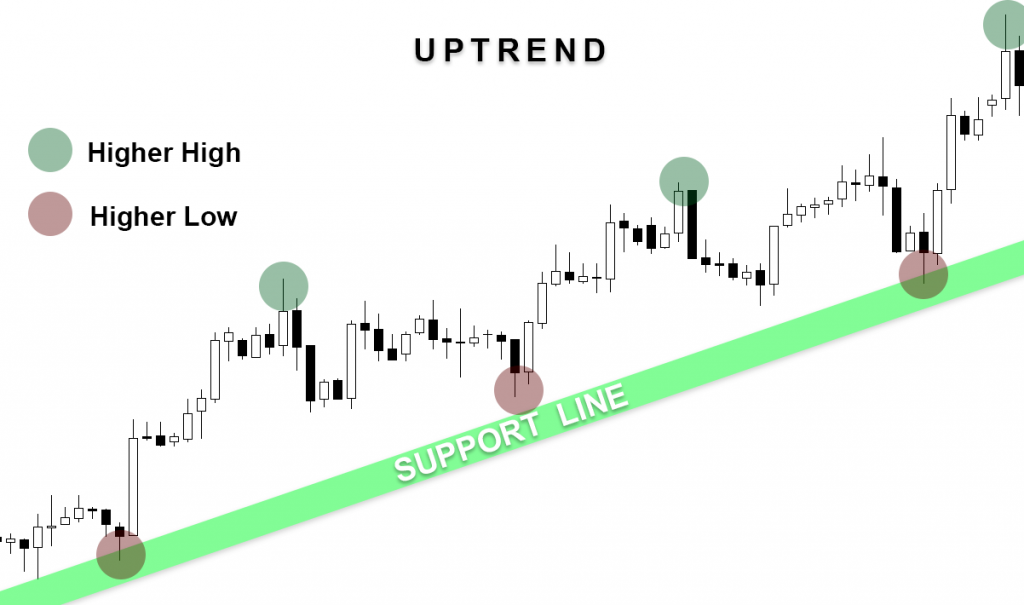
As already stated above, a certain price level prevents the stock prices from rising or falling. This constant barrier is one of the most important aspects of support and resistance. However, these barriers are constantly changing based on a downward or upward trend and thus traders must also focus on the concept of trendlines and trending when it comes to determining the support and resistance levels. When asset prices are trending upwards, it results in the formation of resistance level since the price movement slows down and starts pulling back towards the trendline. This happens due to uncertainty among traders or because they choose to take profits. On the flip side, when the asset price is trending downwards, investors will wait for it to drop further and connect all the peaks with each other using a trendline. Hence, as the price nears the trendline, almost every trader will wait for the stock/asset to come under pressure and may also choose to enter a short position, as this is the very position where they’ve witnessed a price downtrend earlier. Traders who rely on technical trading generally use the identified resistance and support levels to determine their entry as well as exit points in the market.
The Round Numbers
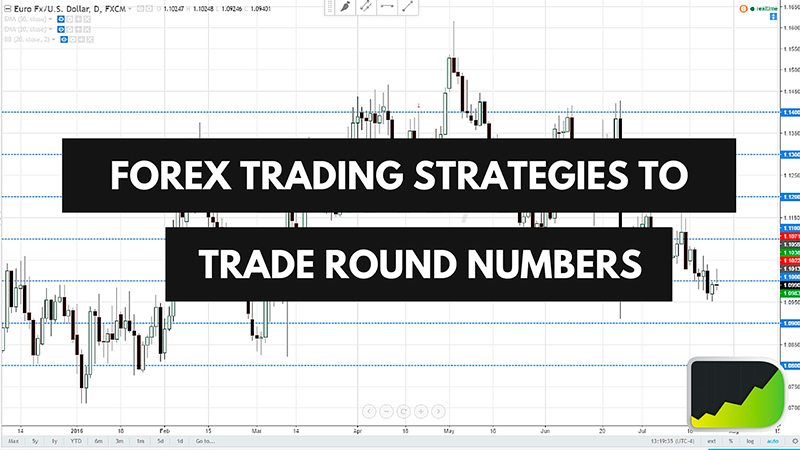
Yet another major aspect of support and resistance levels is that the price of a stock may face difficulty in moving past a round figure or pricing level. Traders who’re new to trading generally end up buying or selling stocks when their prices are in round figures. This happens because traders often assume that the asset price is fair only when it is in whole number. As a result, the stop orders that are set by leading investment banks as well as retail investors are set at round figures. Since a large number of orders are set at round figures, these numbers serve as potent pricing barriers. Hence, when each and every trader of a bank places their selling orders at a specified target, then it further creates a resistance level.
Technical Indicators
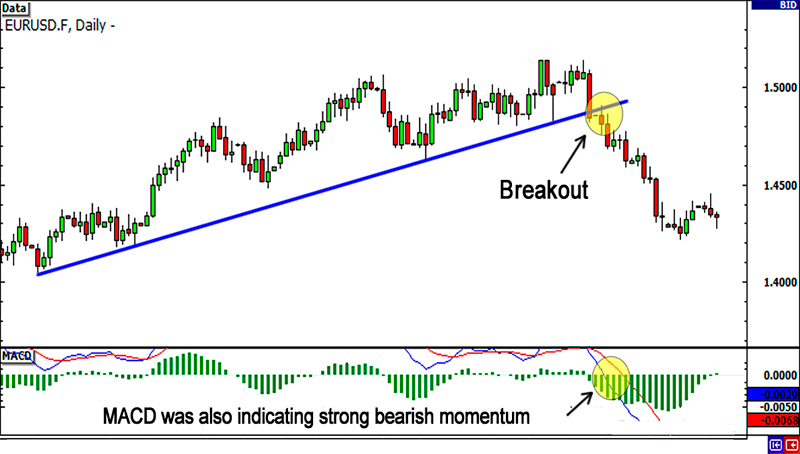
There are many other technical indicators that are used for identifying future price barriers. A technical indicator may appear complicated initially and require a trader to experience and practice them for effective decision making. For instance, the Fibonacci retracement is one of the widely used technical tools as it helps traders in clearly identifying the potential resistance and support levels.
Pivot Points
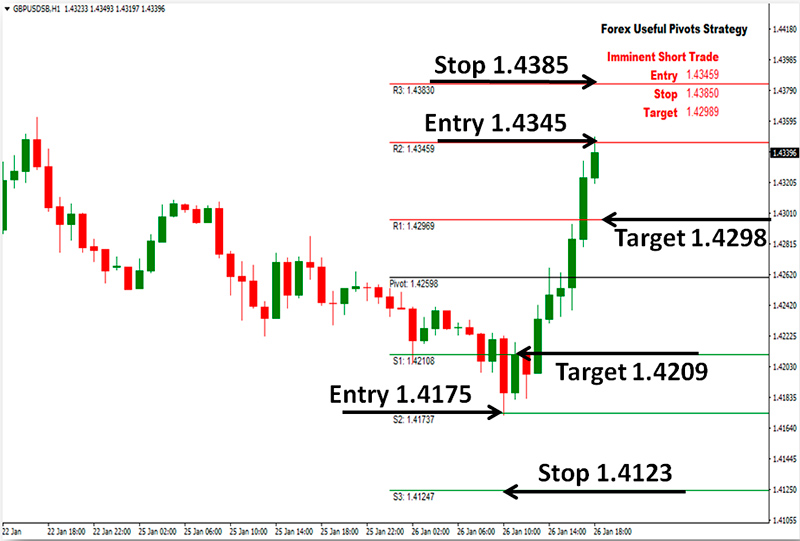
Pivot points are in-built technical indicators that enable traders to identify support/resistance levels quickly and conveniently. They are formed as a result of the high, close and low prices of the previous period. The most commonly used period is the daily period.
Conclusion
Traders need to understand that identifying the future support levels can help them in improving their returns to a large extent, especially in the case of a short term investment. This is because it provides traders with a clear picture of the price levels that would push the pricing of a specified security in case of any correction. On the other hand, identifying the resistance level can help them in determining the pricing level that may harm their long term investing strategy, as it indicates the area/position where traders would be more than willing to sell off the security. Depending upon their convenience, traders can choose a wide variety of methods for identifying the support and resistance levels. Additionally, they also need to practice and test these methods to understand the concepts of support/resistance appropriately. While, most of the traders get confused or consider the support and resistance levels to be highly confusing, focusing on the basics of trading can help them in identifying support and resistance levels and interpreting it conveniently.