Best Techniques Of Using Awesome Oscillator (AO) Indicator in Day Trading

Forex traders use a wide variety of techniques to assess the trends and market conditions. This further enables them in placing safe and profitable trades. In fact, it helps them in identifying unfavorable market situations and further place their stop loss orders accordingly. While, some traders conduct market analysis through technical indicators others use charts to understand as well as gauge the uptrends and downtrends. Awesome oscillator is one of the most commonly used technical indicators. It uses simple techniques to determine market momentum and trends. Here, learn more about AO or awesome oscillator indicator and the best techniques for using them for day trading.
Awesome Oscillator Defined
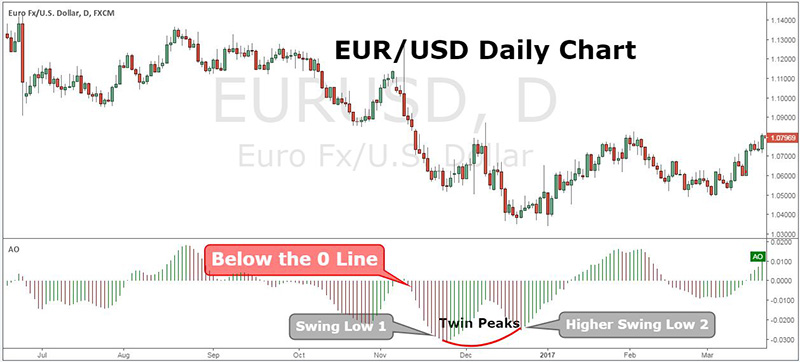
AO also referred to as the Awesome Oscillator is an indicator that signals momentum. It reflects the exact changes that take place within the market forces that further helps in identifying the strength of the trend in terms of reversal as well as formation.
It is basically a histogram style indicator, which is used for measuring the momentum of the market. The oscillator was launched by Bill Williams for understanding a currency pair’s momentum and movements. The AO indicator confirms the market trends as well as the points of reversals.
How it Works?
The indicator is pretty simple to follow and understand. It is essentially a moving average crossover. In this indicator, a 34 period simple moving average is deducted from a 5 period simple moving average. Both the lines are drawn across the midpoints of the bar instead of opening or closing prices.
The Awesome Oscillator values keeps fluctuating below as well as above the zero line. The values that come as a result of this oscillation are displayed in green as well as red price bars. While, red denotes a bar lower in comparison to the earlier one, green indicates a bar higher in comparison to the previous bar.
Using AO for day trading
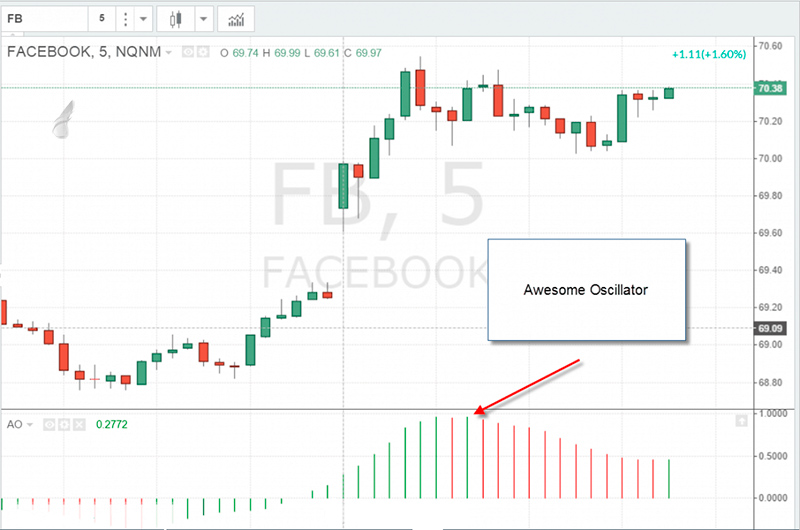
When it comes to using the AO indicator, traders can basically use three different types of strategies discussed below.
They can either choose to open a selling position as and when the Awesome Oscillator drops beneath the zero line, resulting in a peak formation. On the other hand, they can open a purchasing position as and when the awesome oscillator moves beyond the zero line resulting in a gap.
Another strategy could revolve around opening a selling position in the trade after the oscillator has formed two peaks right above the zero line wherein the 2nd high is lower in comparison to the previous high. On the other hand, traders can open a buying position after the awesome oscillator forms two lows under the zero line, wherein the previous one isn’t as lower as the one before.
The third strategy for using the awesome oscillator could be after the awesome oscillator has crossed the zero line from top to down. This time is perfect for opening a selling position and after it has moved from down to all the way up, traders can open a buying position.
Three Signals in AO Indicator
Traders using the AO trading techniques and strategies will notice that there are basically three different signals in the AO indicator.
-
Cross Below or Above the Zero Line
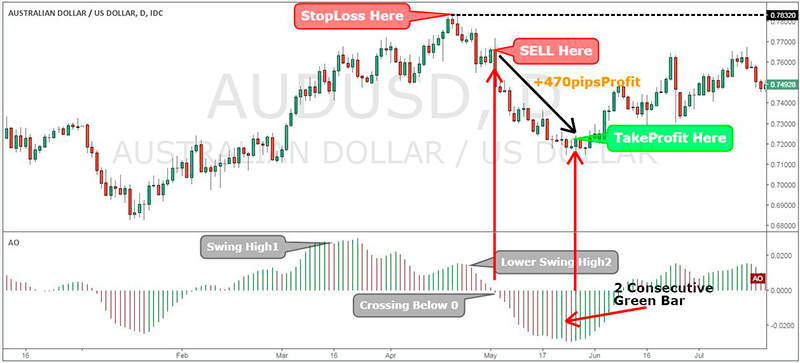
Traders who opt for this particular strategy may end up losing all their money. Hence, they’re advised to tread cautiously. Forex traders must always cross check with other sources and analyze the market trends thoroughly before placing their trades using this technique. This strategy basically encourages traders to opt for a long position after the oscillator has moved from the negative to a positive area. Similarly, after the AO indicator has moved from a positive to a negative area, traders must opt for a short position.
-
The Saucer
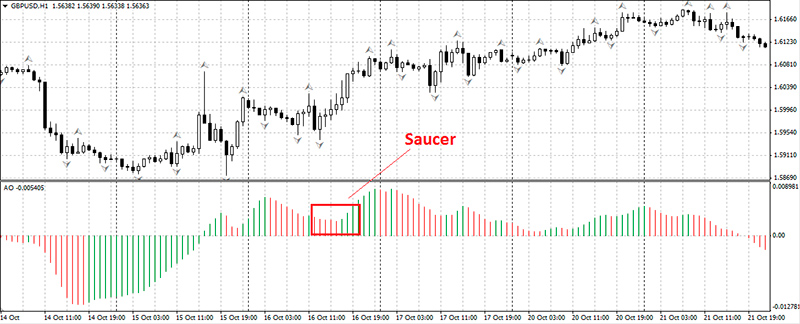
The Saucer technique basically consists of three different histograms for short as well as long positions. In case of a long position, the AO indicator moves beyond 0 and it reflects 2 consecutively built red colored histograms. The 2nd red colored histogram is short in comparison to the first one and the 3rd histogram is visible in green color. As a result, traders purchase the 4th candlestick on the open.
In case of the short position, the AO indicator is under 0 and the indicator features two consecutively built green colored histograms. The 2nd green colored histogram is shorter in size when compared to the earlier one. The 3rd histogram is visible in red and traders sell the 4th candlestick on the open. Hence, this appears as three candlestick reversal patterns, which continues to move in the primary trend’s direction.
This strategy is better in comparison to the 0 cross as it involves a basic formation across the three different histograms. However, this particular pattern cannot be easily identified through the chart and can only be spotted when you engage in day trading on a repeated basis for the entire day.
-
The Twin Peaks
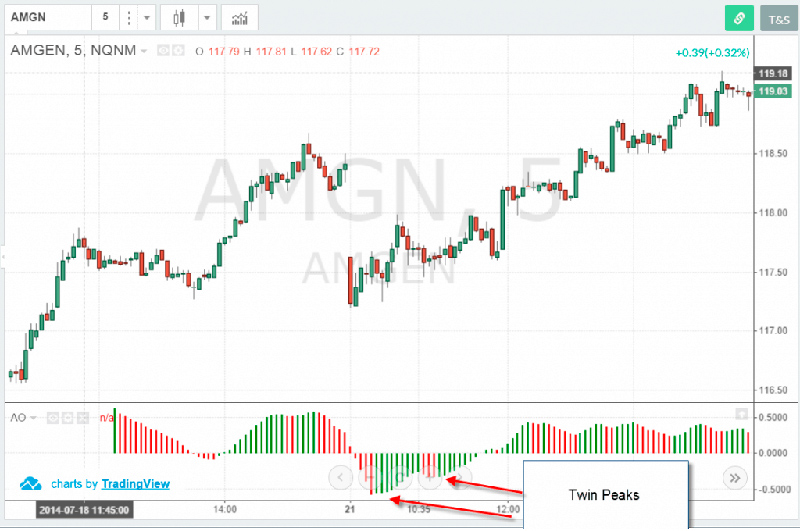
In this strategy, traders basically look for double bottom in the indicator. Hence, the twin peaks are bullish when the AO is under 0 and the indicator displays 2 swing lows wherein the 2nd low is higher in comparison to the 1st one. In this case, the histogram becomes green in color after the 2nd low formation.
The twin peaks are bearish when the AO indicator moves above 0. In this case, traders can view 2 swing highs in the oscillator wherein the 2nd high is lower when compared to the 1st one. As a result, the histogram becomes red in color post the formation of the 2nd peak. The twin peaks strategy is the best of all the three trading strategies. This is because it indicates the existing stock setup. It is also contrarian in nature because a trader goes short after the AO is beyond 0 and purchases when it is under 0.
Conclusion
Traders must therefore look to filter the false trading signals and purchase or go shorter before the actual crossing of the zero line. This would help them in keeping away from choppy trends and market situations. It would also help them in reaping the profits that arrive before a confirmation as a result of the breaking of the zero line.
Thus, if you possess basic knowledge of math, then understanding the AO indicator wouldn’t be that huge a problem. In the AO formula, traders basically need to compare two different moving averages including long term and short term with the help of the candlestick’s midpoint. This would enable the traders to assess the activities of the day. The mid-point would be larger when there is a great deal of volatility in the market.