ETH/USD – Weekly Outlook
Weekly Forex Forecast to trade Ethereum
Ethereum, the smart contract, ICO launching blockchain platform, comfortably sits as the second largest cryptocurrency by market capitalization. Following a clamping down on ICOs (Initial coin offerings) in China, and harsh regulations in the United States and South Korea, there was a huge correction in the price of Ethereum traded against the United Stated dollar.
Speculative Demand for Ethereum
Compared to the speculative demand in our February analysis of Ethereum, it’s obvious from the above chart that speculative demand makes more frequent moves above the 50K mark. This implies that the Ethereum use case is regaining attention among traders and speculators alike, hence the need to trade Ethereum.
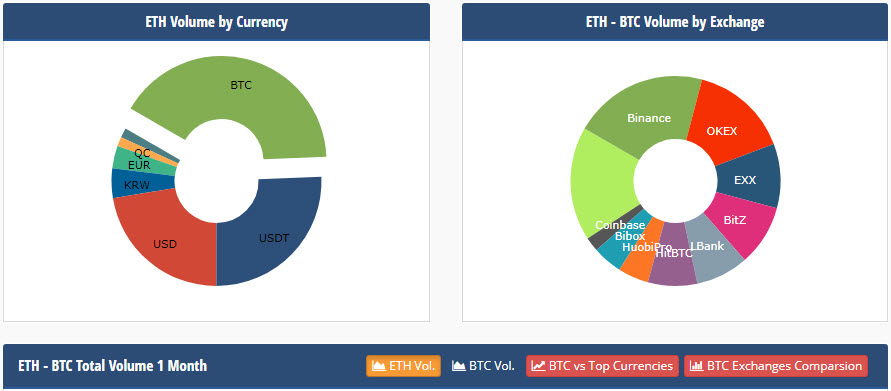
Referencing the chart above and considering Ethereum volume by currency; it’s good to know where the volumes are coming from. Though the BTC carries a higher chunk of the pie, the USD and USDT combined carry a higher volume, followed by the Korean Won, and the Euro. What this implies is that the volumes are coming from the United States, Korea, and Euro.
Ethereum transaction chart
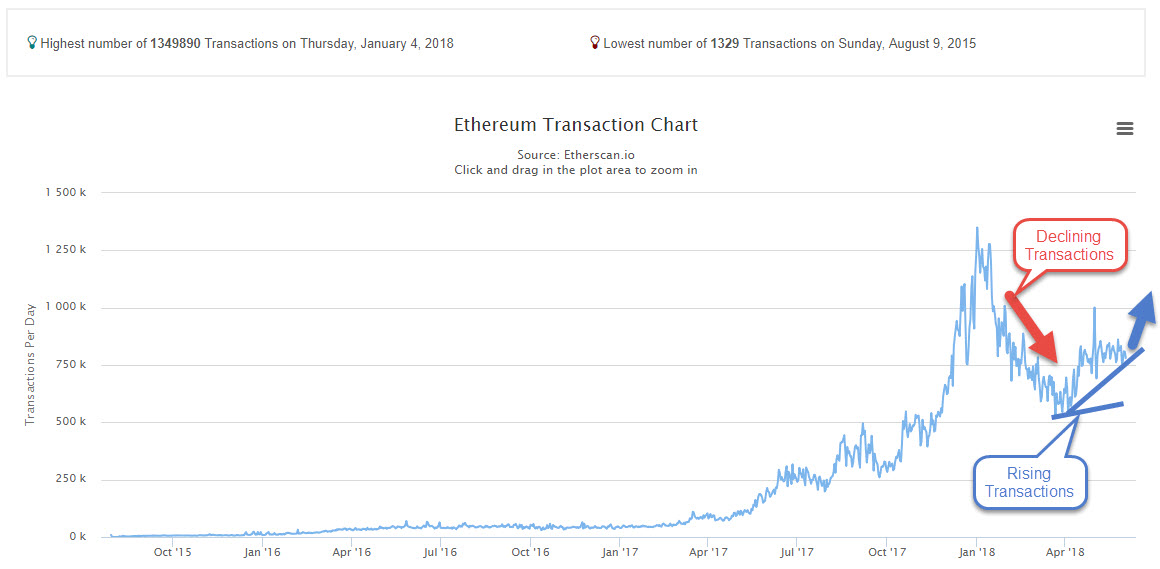
Following Vitalik Buterin’s thoughts and insights on Sharding and plasma at a special meeting held by OmiseGo on 30th May, the Ethereum transaction chart is beginning to show optimism as demand for Ether shows a steady rise from it bearish direction. According to Vitalik, the Ethereum blockchain can support up to 15 transactions per seconds, which he considered inefficient. He went on to explain Sharding as a layer 1 solution to Ethereum network scalability problems. Buterin further continued to shed more light on Plasma, as a second layer solution to the scalability issues.
Further reading can be found at this link where the founder highlights how the transaction speed can increase with Sharding and Plasma.
Pending Transactions
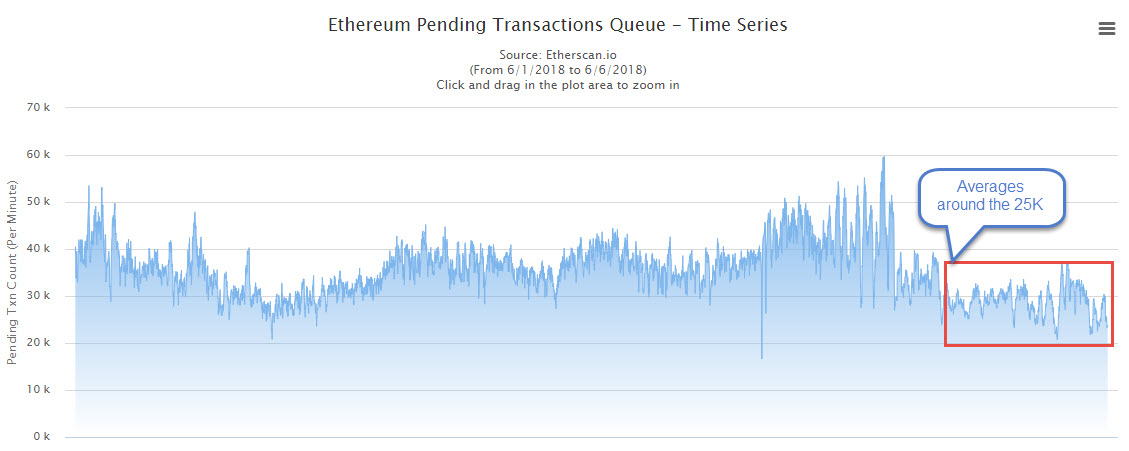
As shown above, the number of pending transactions currently ranges lower than the earlier periods which could imply an improvement of some sort to the network or just a decline in activities.
Technical Analysis
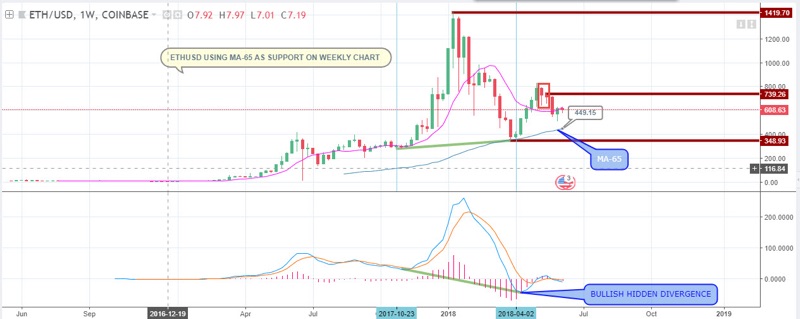
From a technical point of view and the weekly chart to be specific, ETHUSD bounced off the $348.93 support level on 02-04-2018, pushing the pair away from the moving average. The pair again moves towards the MA-65 for the second time and we are beginning to see signs of support around the zone. Not to forget the bullish divergence pattern formed, which we believe is still active.
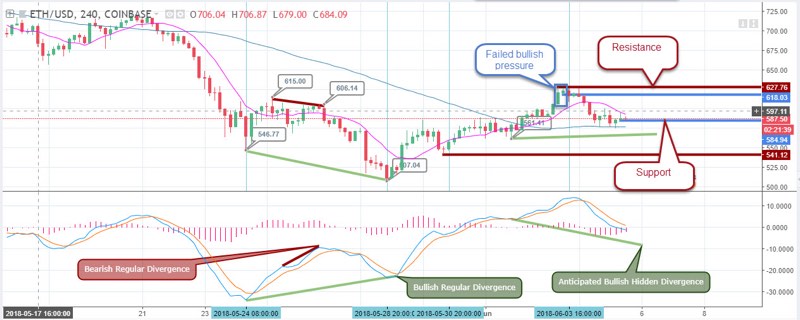
Saving the best for the last, we are taking a look at the 4-hour chart which offers a better overview of the price activities of the pair. As mentioned in the weekly time frame, price again moved towards the MA-65 of the weekly chart. Zooming closer to the 4-hour chart, we can clearly see a bullish regular divergence formed on 28-05-2018. This also accounts for the support noticed on the weekly chart.
This week, a bullish hidden divergence is anticipated to signal a continuation of the bullish move, with buy pressure support at $584.94. The pair currently trades above the MA-65 of the 4-hour chart with a high probability of supporting the bullish campaign.
Conclusion/Projections
This week has been quite an upward moving rollercoaster for the ETHUSD pair and moving forward into the following week, we expect the pair to close above the $627.76 resistance as illustrated on the chart.
Hopefully, this will encourage hodlers to want to trade Ethereum with any of the Ethereum brokers out there. Most brokers and exchanges these days list Ethereum for trading, against a whole lot of cryptocurrency and fiat currencies. Let’s see how it all turns out next week as we adopt a set and forget entry system.
Top 3 Brokers to trade Ethereum


No Comments found