Bitcoin to USD ( BTCUSD ) Weekly Outlook , January 17 2019
BTCUSD Forecast and Technical Analysis & Fundamentals for Bitcoin
Introduction
An increase in miners’ reward finally confirms a bottom of the Q2-Q4 2019 bullish wave correction of the BTCUSD on Binary.com broker.
This week, we analyze the key resistance levels that were breached, as well as significant reversal chart patterns that have brought the crypto giant out of a mid-term bearish trend.
A comparison of Miner’s Reward to the Bitcoin BTC vs. USD: Weekly Chart
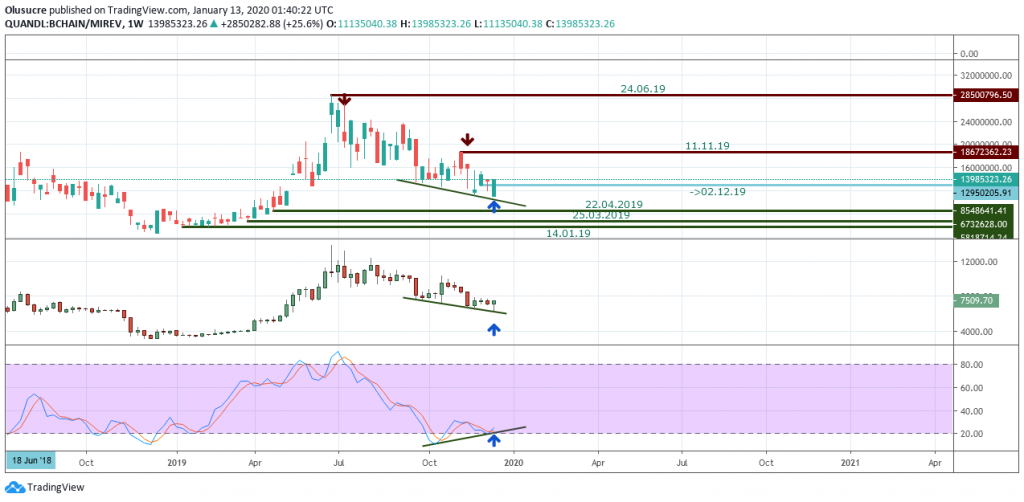
A weekly chart overview of the MIREV Miners’ Revenue chart shows an accumulation pattern that indicates an increase in the revenue.
Signaled in combination with regular bullish divergence, we take it as a confirmation to the 185days correction of the bullish trend.
BTCUSD Technical Analysis
Monthly Chart
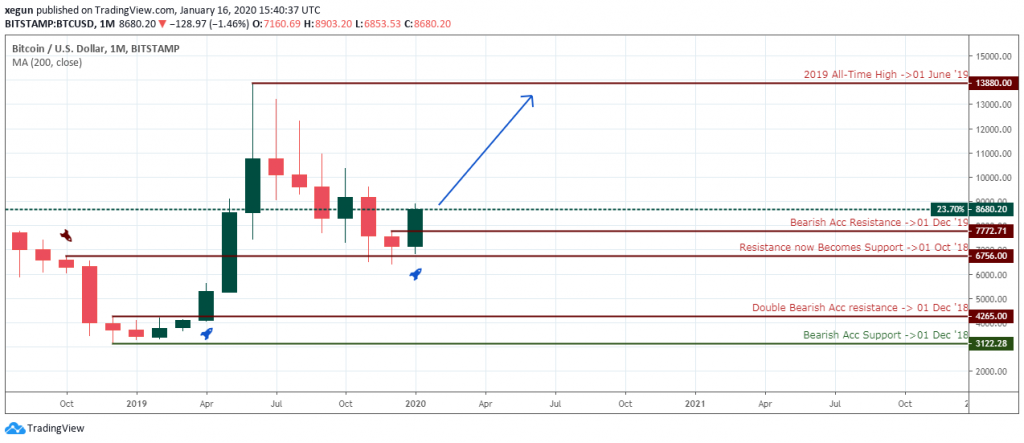
The monthly chart above shows a threatened breakout of the December 2019 resistance, a move similar to the price break of the December 2018, which confirmed an end to the 2018 crypto winter.
If the price closes above this level at month-end, then we should see the BTCUSD soaring towards the June 01, 2019, all-time high.
Notice how October 01, 2018, resistance ($6756.00) now serves as a support for the Bitcoin price at the close of December 2019.
Conversely, a price close below the $6425.00 support would result in further price slump towards the $3122.28 support level of December 2018.
However, we are more optimistic about an end to the corrective phase of the bullish trend.
Weekly Chart
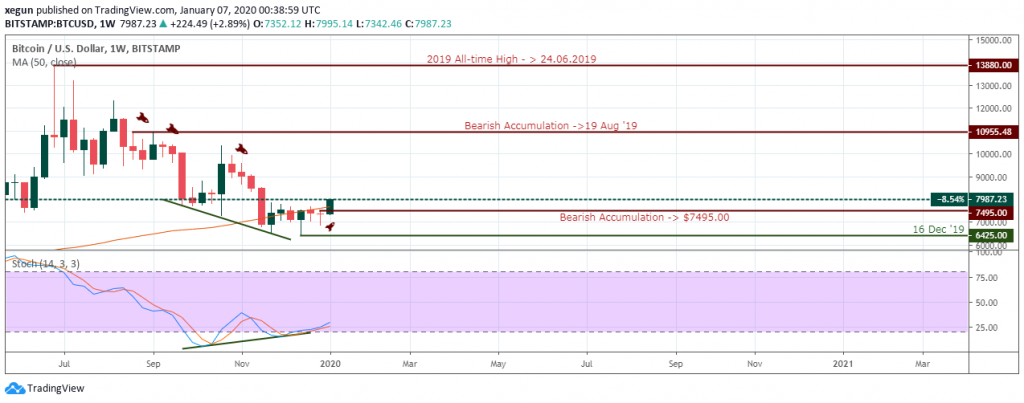
The BTCUSD finally closed above the December 30 significant bearish resistance level ($7495.00), as a result of an increase in demand for the number one cryptocurrency by market cap.
The bullish momentum continued into this week after the breakout, and regular bullish divergence pattern and has so far increased by 8.83% from the weekly opening price.
Daily Chart
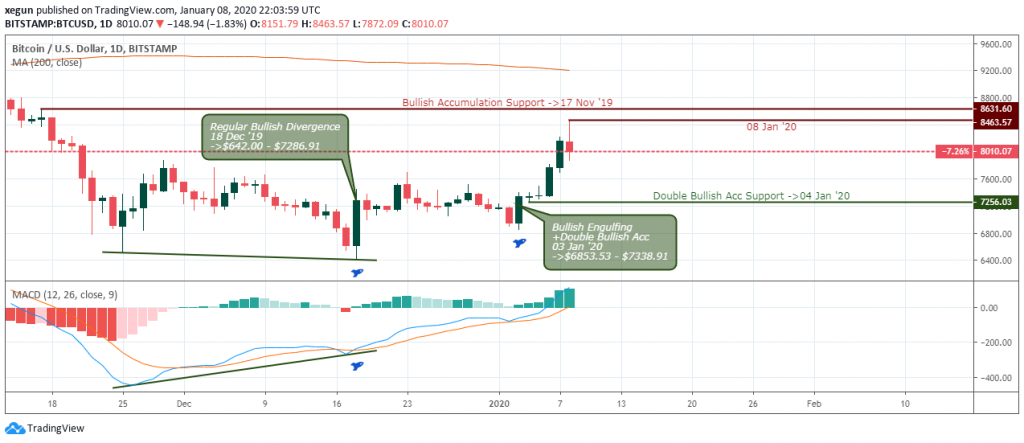
An overview from the daily time frame also reveals a regular bullish divergence pattern, however, of the MACD oscillator.
The BTCUSD at publication time hovers beneath the MA-200 and may eventually close above it in the coming week. For now, we see this level as a major price objective of the Bitcoin price this week.
4Hour Chart
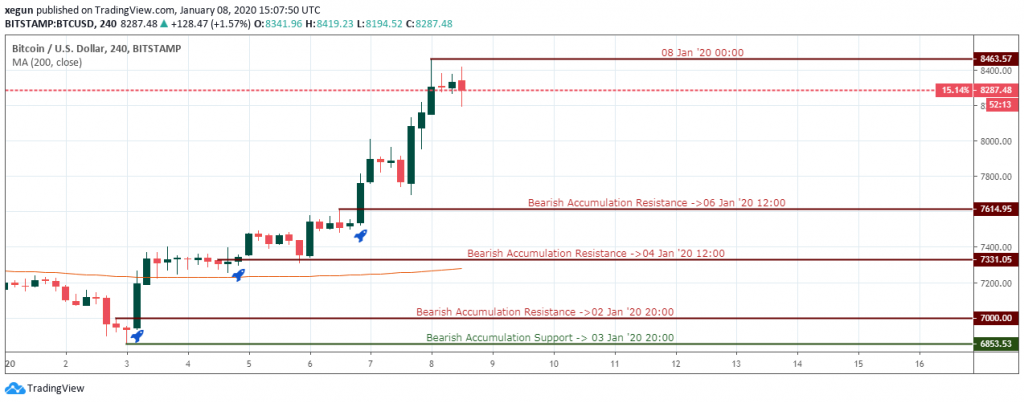
To round up on the 4hour time frame, the Bitcoin BTC on all Bitcoin broker/exchanges closed above the significant January 02, 2020, 20:00 resistance, and later found support on the MA-200.
Bitcoin Fundamentals
JP Morgan: Launch of New CME Bitcoin Options to Cause Shift in Investor Behaviour
Analysts of United States’ biggest bank JP Morgan have stated that there will be a high interest in new Bitcoin (BTC) options of the CME Group after its launch on Jan 13.
In a Bloomberg report carried out on Jan 10, the group of JP Morgan analysts with the leadership of Nikolaos Panigirtzoglou observed that interest in existing Bitcoin futures had gone up, days to the launch.
According to the analysts, the change in investor behavior can be seen in the remarkably strong activity over the past days reflecting high expectations among market shareholders of the option contract.
Conclusion and Projection
This week’s opening price confirms a bottoming of the 2019 correction phase.
An advance above the $777.71 monthly chart resistance by January’s closing price would be a final confirmation to reinforce an upward price hike.

No Comments found