USDINR – Weekly Outlook & Analysis for February 21 2019
USDINR Forecast & Technical Analysis
Introduction
The Indian Rupee has been in a struggle with the USD on Iq Option platform, setting resistance levels that may or may not stand the test of time.
This week, we’ll establish the resistance and support levels and reveal possible price trends around them. We’ll also touch on some macroeconomic indicators for the USD and the INR that we believe may serve as a catalyst for price moves.
India’s Fundamentals
India Interest Rate Decision
Within any country’s monetary policy, policy rates are the most important as any changes in them affect inflation, economic growth, unemployment, and exchange rate.
The monetary policies are actions taken by a country’s government or apex financial institution or governing body to achieve some national financial goals. The policy rate is based on the correlation between interest rates at which money can be borrowed and the cumulative supply of money.
When data reading is lower than expected, a bearish move is expected for the currency. When the data reading is higher than expected, positive sentiment is expected for the currency.
Following the latest release made on February 6, which shows that the actual, previous, and actual readings are 5.15%, traders can expect a bearish sentiment for the Indian Rupee.
U.S. Producer Price Index (PPI)
The Producer Price Index (PPI) is an evaluation of the difference in the price of goods sold by manufacturers.
The indicator is a key way of measuring consumer price inflation, which is responsible for the majority of overall inflation.
When data reading is lower than expected, a bearish move is expected for the currency. When the data reading is higher than expected, positive sentiment is expected for the currency.
Following the latest release made on January 15, which shows that the actual reading is 0.1%, while the previous reading is 0.0%, and the forecast figure is 0.2, traders can expect a bullish trend for the USD.
USDINR Technical Analysis
USDINR Long term Projection: Bullish and Correcting
Monthly Chart

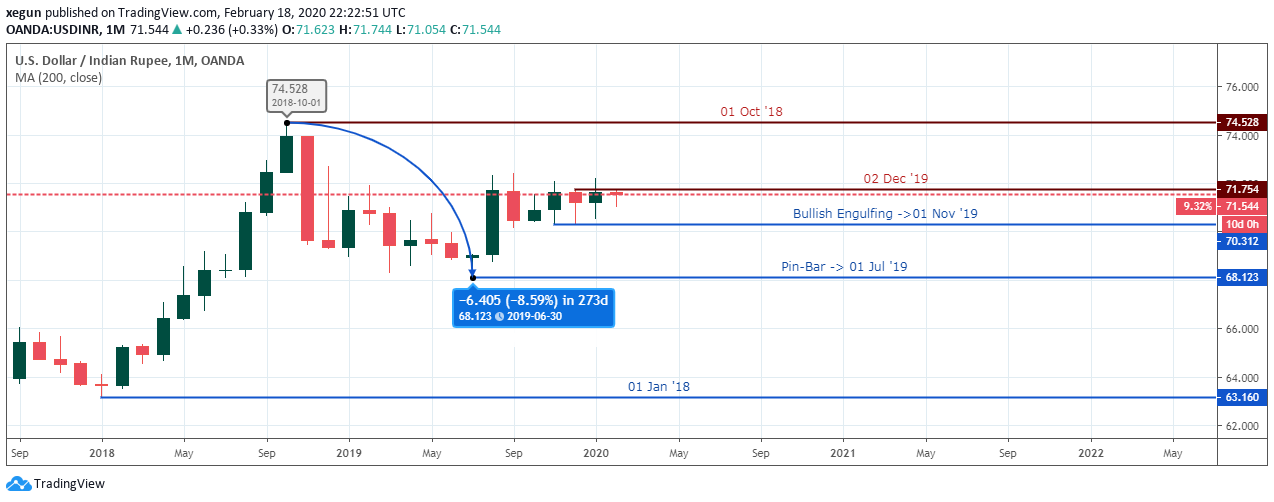
The USD to INR from a monthly chart overview confirms its corrective wave after a -8.595% price slump from the Oct ’18 high at 74.528.
The pair has been in a range for six months since the price surge out of the correction phase, and we lean more towards a breakout above the Dec 02 ’19 high (71.754) for a price objective at 74.528 sets on Oct ‘18.
On the other hand, we may see a sudden decline in the exchange rate, if the bears break below the 70.312 significant support.
Weekly Chart

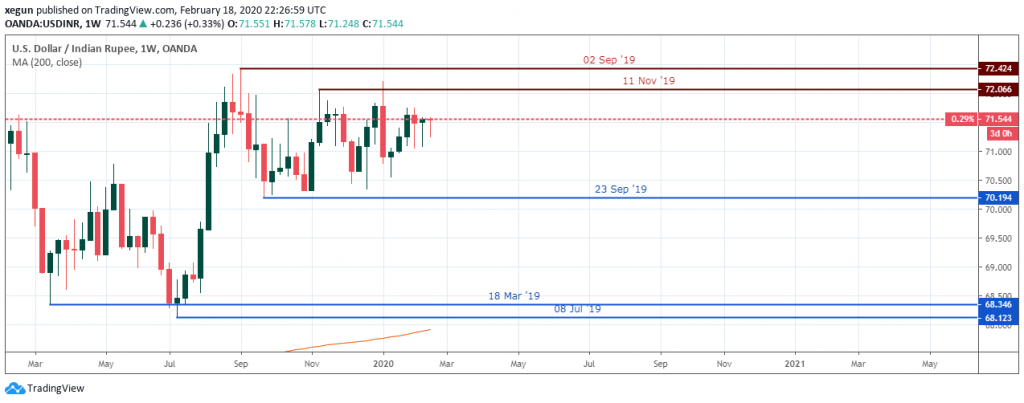
Viewing from the weekly time frame, the USDINR enters a mean reversion mode, as it oscillates between the Nov 11 ’19 significant high and Sep 23 ’19 significant low.
Although there’s a resistance level set at 72.066 in favor of the Indian Rupee, the USDINR currency pair sets higher lows from the 70.194 support to form an ascending triangle formation.
USDINR Medium Term Projections: Bearish and Bottoming
Daily Chart

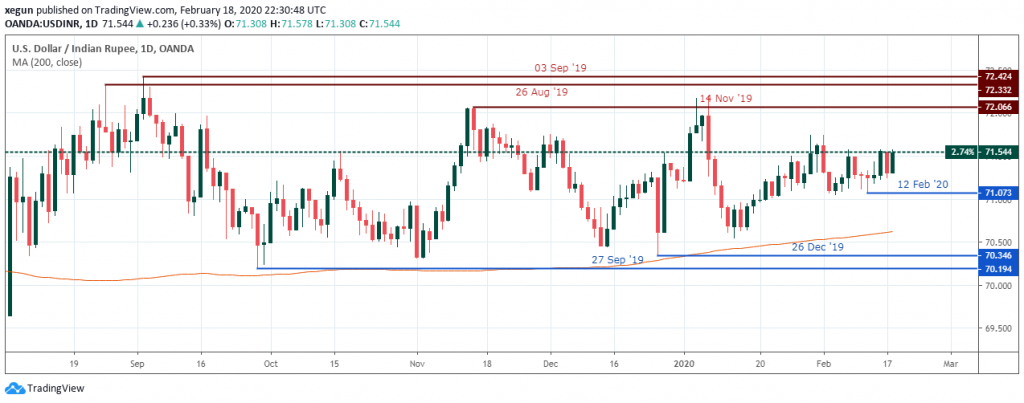
The daily time frame overview of the USDINR shows the pair in a sideways market structure while trading above the 200MA, a major reason why we favor enter long-only positions compared to the shorts. Although we may choose to allocate more funds to buy signals compared to the sell signals.
4HR Chart

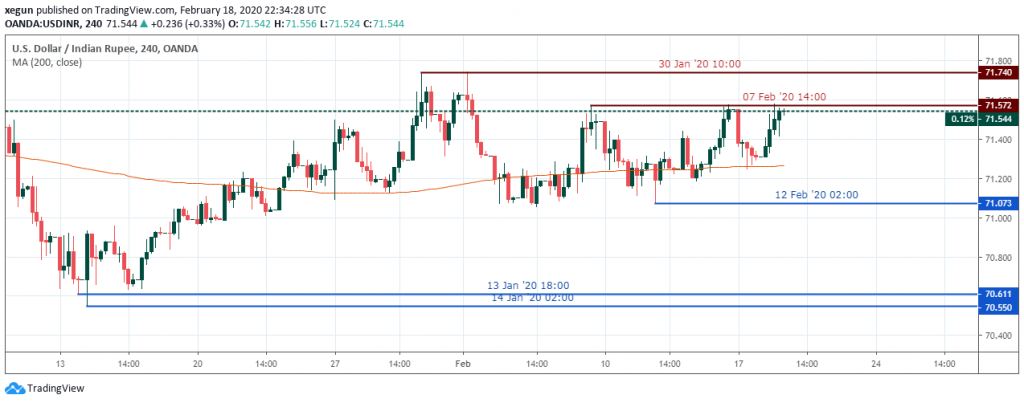
The 4hour time frame, like the daily and weekly, leans towards the bullish trend as the bears set up a trip top chart formation at press time.
We should look out for an extended bullish price cycle if the resistance level 71.572 fails to increase demand for the USD.
Conclusion and Projection
From the above analysis, the market structure leans towards a sideways market structure, favoring mean reversion trading methodologies. We, however, suggest that traders allocate more funds towards the bullish direction compared to the bearish direction.

No Comments found