USDINR – Weekly Outlook ( February 1 2018 )
USDINR : Weekly Technical Analysis for India Forex Trading
Introduction
The month of November and December were great for the Indian Rupee as the currency strengthened against the U.S dollar. However, entering the New Year the USDINR start to see those gains gradually drift away. Join us this week as we take a look at the technical and fundamental events that are major drivers of the exchange rate.
India’s Fundamentals
India: Federal Fiscal Deficit, Infrastructure Output and FX Reserves in USD
The two important events from India this week are the FX Reserves Federal Fiscal Deficit. The Reserve Bank of India will be releasing the latter this Friday which is a reflection of purchases and sales of foreign exchange by the Central Bank, with previous readings at $396.68B. A reading higher than the previous indicates bullish sentiment towards the Indian Rupee, on the other hand, a lower reading will show bearish sentiment.
To be released by the Controller General of Accounts is the Federal Fiscal Deficit which shows the change between revenue received by the government compared to overall spending. A negative reading will indicate a surplus of Indian accounts, hence bullish outlook, on the other hand, expansion of debt is negative for the Indian Rupee.
United States Fundamentals
United States: Institute for Supply Management Manufacturing PMI
The index which is to be released on Friday 01 February shows business conditions in the US manufacturing sector. It is a highly important indicator of the overall economic condition in the United States. Results greater than 50 implies bullish sentiment towards the dollar, while readings less than 50 implies negative sentiment. The previous readings were at 54.1 and the consensus is at 54.3.
Technical Analysis
USDINR: Monthly Chart

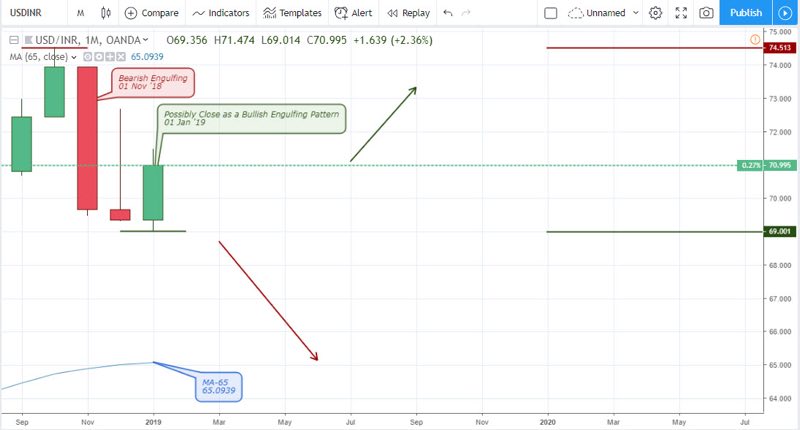
Last year November, the USDINR closed and signaled a bearish engulfing candle pattern. This is a strong reversal pattern as price may decline further towards the 65-period Moving average upon closing below January’s low at 69.001. Although it is not so clear, the month of January currently threatens to close and trigger a bullish engulfing candle pattern.
USDINR: Weekly Chart

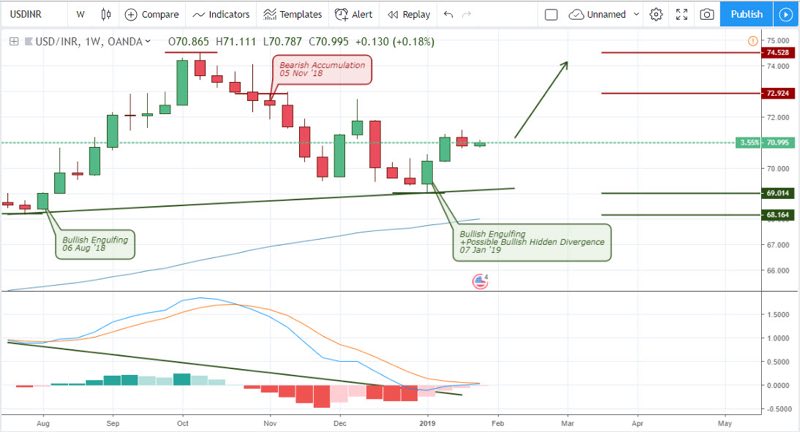
Moving one step down to the weekly chart, we start to get better clarity as to the technical patterns unfolding. The bullish engulfing pattern triggered after a bearish accumulation pattern is a strong continuation pattern for a bullish trend. This plan offers early confirmation to an unfolding bullish hidden divergence within the same time horizon. From this point, we expect the exchange rate of the USDINR to soar upwards towards the 72.924 and 74.528 resistance level.
USDINR Daily Chart

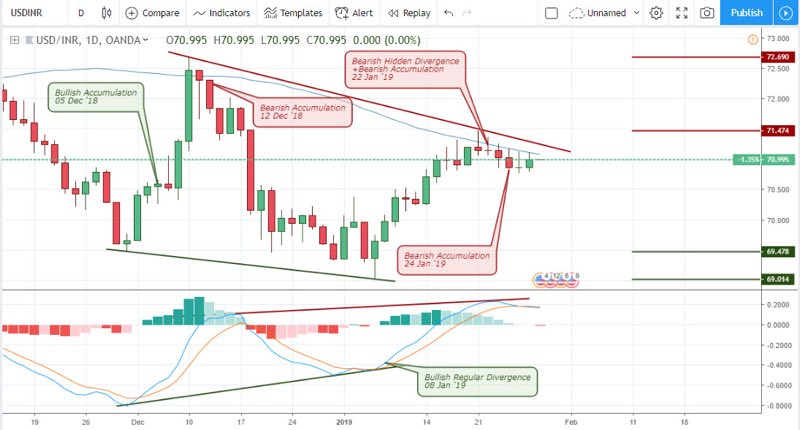
Bullish regular divergence on January 8 ’19 of the daily chart is confirmed by the MACD golden cross and coincides with a similar anticipated pattern from a weekly perspective. At the moment, the price is trapped under the MA-65 and an opposite bearish hidden divergence pattern is triggered by the MACD dead cross and a bearish accumulation pattern.
USDINR 4-Hour (H4) Chart
An early confirmation of the bearish divergence was triggered by a similar divergence pattern on January 21 ’19 14:00, forcing the price to hover around the 65 period moving average. A recently triggered bullish accumulation on January 27 ’19 22:00 threatens a continuation of the bullish trend.
Conclusion and Projection
It’s obvious the U.S dollar is gradually eroding the previous gains of the Indian Rupees as shown on the daily and weekly time frames. It is worth mentioning that at the point of publishing this article, a recent bullish accumulation pattern on the daily chart brings an end to the bearish hidden divergence pattern and a continuation of the USD’s dominance.
In order to take advantage of the bullish trend or similar swings analyzed, you may like to visit the Binomo broker section of our website or our list of handpicked Indian forex brokers to carry out your trading operations.

No Comments found