USD to INR – Weekly Outlook ( August 30, 2018 )
Weekly Forecast for India Brokers
Introduction
The Indian Rupees has been experiencing a bearish outlook as it gets hammered by the U.S. dollar in the past five months. Even in the midst of a drop in shorting of Asian stocks, it doesn’t seem to have any positive impact on the INR exchange rate at the moment.
India’s Fundamentals
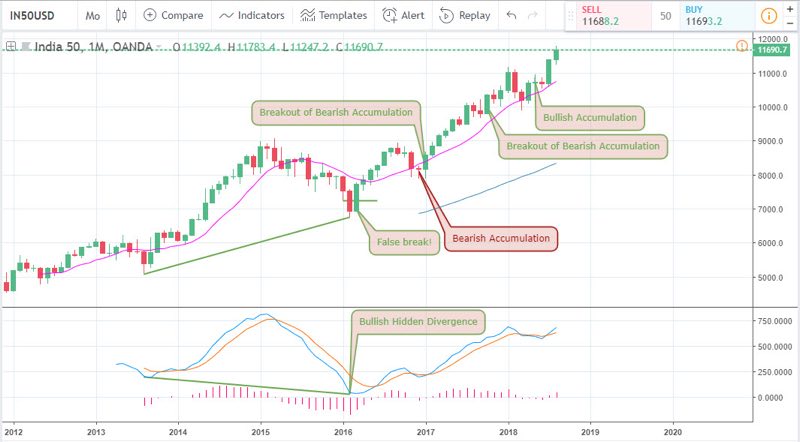
India 50 Monthly Charts

The monthly chart of the India50 index indicates a positive outlook of the 50 company in the sector. Following a bullish hidden divergence pattern as shown below, the pair continued to signal bullish price action setups in the form of the breakout of bearish accumulation and bullish accumulation patterns.
India’s Interest Rate
It is a known fact that policy rates are the most important driving force of a nation’s economy. A change in rate has a huge influence on inflation, economic growth, unemployment, and of major interest to us, exchange rates.
The forecast for interest rate released on 1st August 2018 came out same with actual. A higher rate compared to the expected would have resulted in a strengthening of the Indian Rupees.
Technical Analysis
The technical setups of the USDINR have all pointed upwards even from a multiple time frame analysis points of view.
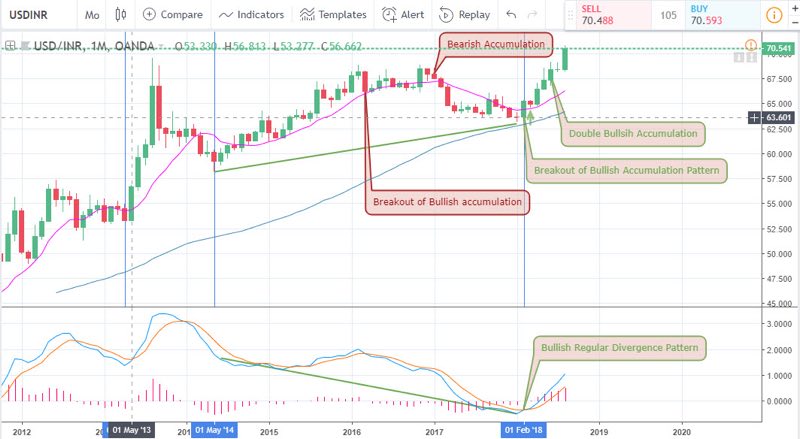
USDINR Monthly Chart

Divergence patterns on higher time frames such as the monthly chart above may take time to form, but when they do, it can be really rewarding. The pair from above entered into a range starting from 01 August 2013 with the highest high of 69.528, and finally signalled a bullish hidden divergence, which ushers the pair into a series of consecutive bullish closing bars on 01 February 2018.
In the last three months, the exchange rate of the INR to USD entered into a double bullish accumulation pattern, consequently leading to the bull rush of August at the moment.
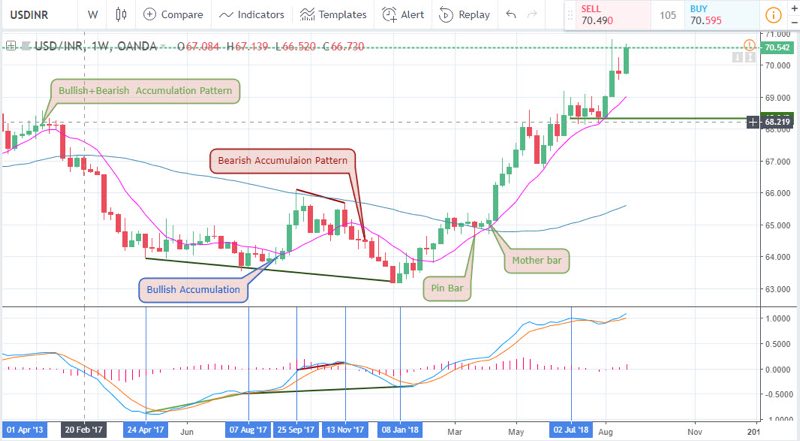
USDINR Weekly Chart

Before the trigger date of the monthly chart, the weekly chart has already begun to show signs of bullish divergence patterns, this time on the 7th of August 2017 and 8th of January 2018. This rollercoaster formation, in combination with the monthly charts divergence, increased the bullish confidence of Indian broker/s and traders alike. As a result, the price jets up into a steadily flowing upward trend with price action setups such as a Pin-bar, Mother bar and a bullish accumulation support of 68.22 on 02 July 2018.
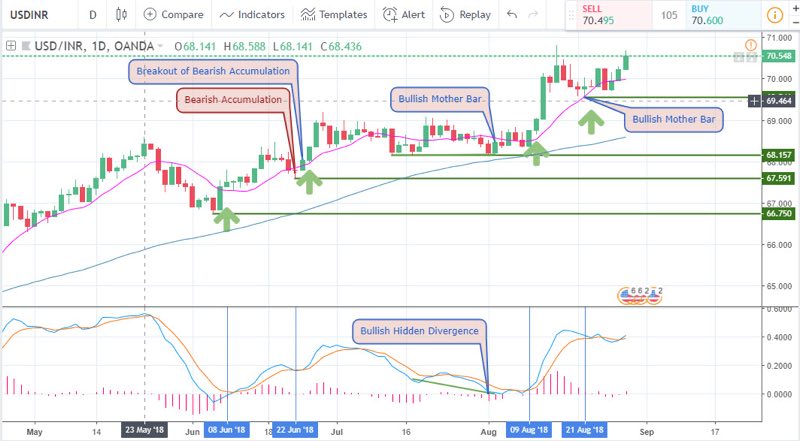
USDINR Daily Chart: Bullish Divergence

For a profitable trading experience, timing is of the essence, and what better place to look for a weekly overview than the daily chart as it offers better entry and trading opportunities. Starting from the 8th of June with a bullish accumulation formation, followed by a breakout of a bearish accumulation pattern on the 22nd of June. The USDINR later formed a bullish hidden divergence pattern on the 9th of August and later a more recently formed mother bar on the 21st of August, pushing the pair to its current price of 70.548.
4-Hour (H4) Time Frame
The 4-hour chart presents a more in depth view of the pair as a bearish divergence pattern formed on the 15th of August sends the pair south, a correction of the U.S. dollar gains. Here we are left only with the golden cross of the MACD oscillator both on the 21st and 27th of August which was also a breakout of bearish accumulation pattern.
2-Hour Time Frame
A further breakdown of the 4-hour chart is the 2-hour chart which as shown above show significant bullish entry signals in the form of the breakout of bearish accumulation pattern which occurred on the 27th of August and 28th of August respectively. These setups establish support levels at 69.696 and 70.074. Most current is the Bullish mother bar support of 70.429.
Projection and Conclusion
From a more objective point of view, the USDINR currency pair is in a ripe stage for profit taking and any further long trades entered at the current high may be likened to playing roulette. On the other hand, after going over the major time frames, there is no clear selling opportunity presented to us in the form of a price action or pattern formation.
Top 3 India Forex Brokers to trade India Brokers


No Comments found