USD/INR – Weekly Outlook for October 3 2019
USDINR Forecast & Technical Analysis
Introduction
The Indian Rupee tried to restore its strength last month in September after suffering a beat by the Greenback in August. In this post, we analyze the major technical and fundamental level every serious XM Forex trader should pay attention to while trading the USDINR.
India’s Fundamentals
India Infrastructure Output
About 26.68% of India’s industrial output is accounted for by the infrastructure sector.
When the reading is higher than expected, it is seen as a positive trend for the INR. When the reading is lower than expected, it is seen as a negative trend for the INR.
Latest data reveals the actual reading to be -0.5%, while previous value read 2.7%, hinting at a bearish trend for the Rupee.
U.S. Average Hourly Earnings
Average Hourly Earnings is the evaluation of the change in the price businesses pays for labor, excluding that of the agricultural sector.
When the reading is higher than expected, it is considered a positive trend for the USD. When the value is lower than expected, it is seen as a negative trend for the USD.
Latest data released September 06 reveals the actual reading to be 0.4%, while the forecast and previous readings read 0.3%, hinting at a bearish trend for the Rupee.
USDINR Technical Analysis
USDINR Long term Projection: Bullish Swing
USDINR: Weekly Chart

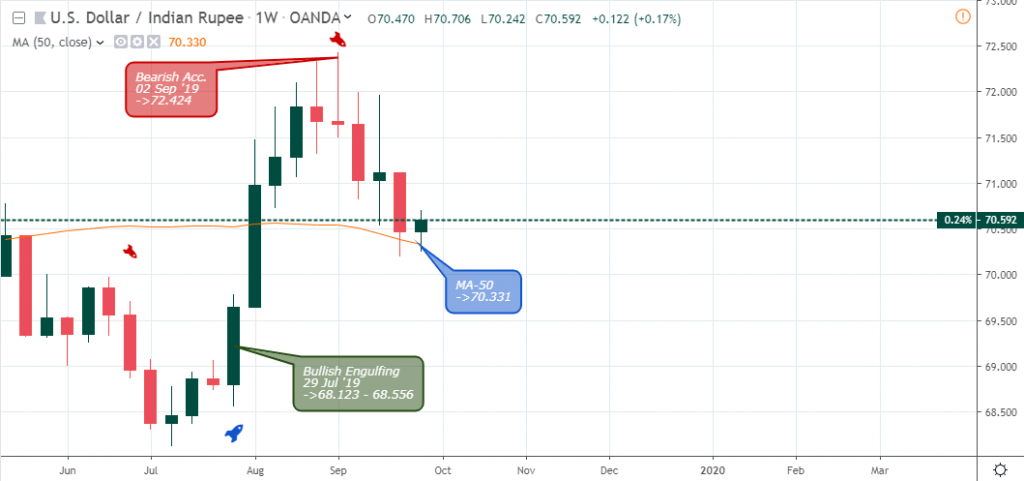
A transition from a bullish to bearish trend started from a bull trap candlestick pattern confirmed on August 26, later followed by a bearish setup on September 02.
Last week’s bearish closing price bar could not close below the MA-50 support, which appears to serve as a springboard for the USDINR.
Let’s take a step lower to the daily time frame to see if we are coming to the end of a correction phase, or resuming a bearish price descent.
USDINR Medium Term Projections: Price Correction
USDINR Daily Chart

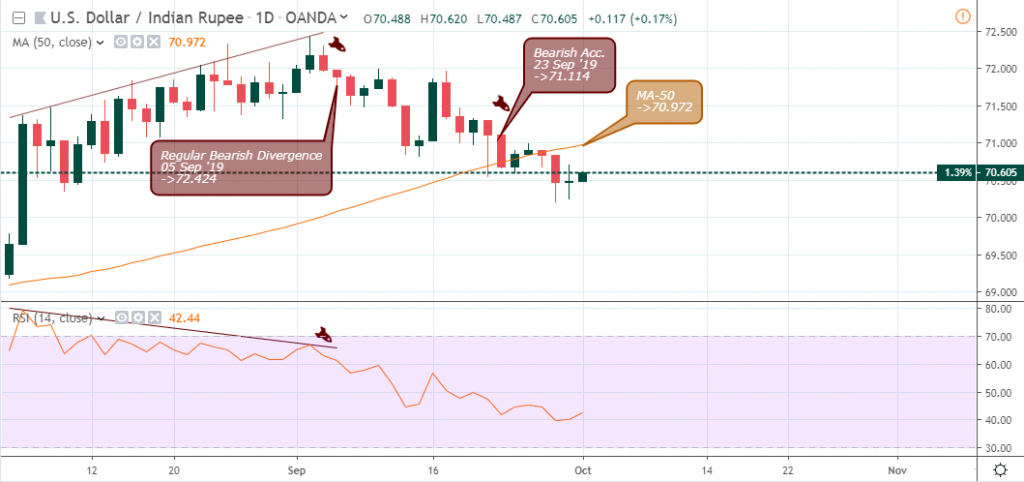
The formation of regular bearish divergence on September 05 reinforced the bearish trend and confidence to short the USDINR.
Upon making contact with the MA-50, the price chart establishes a bearish resistance at 71.114, forcing the pair to breach the Moving Average Support. The Indian Rupee strengthened against the Greenback as it currently trades below MA-50. A breach of the 71.114 resistance will signify an ending to the bearish move.
USDINR 4HR Chart

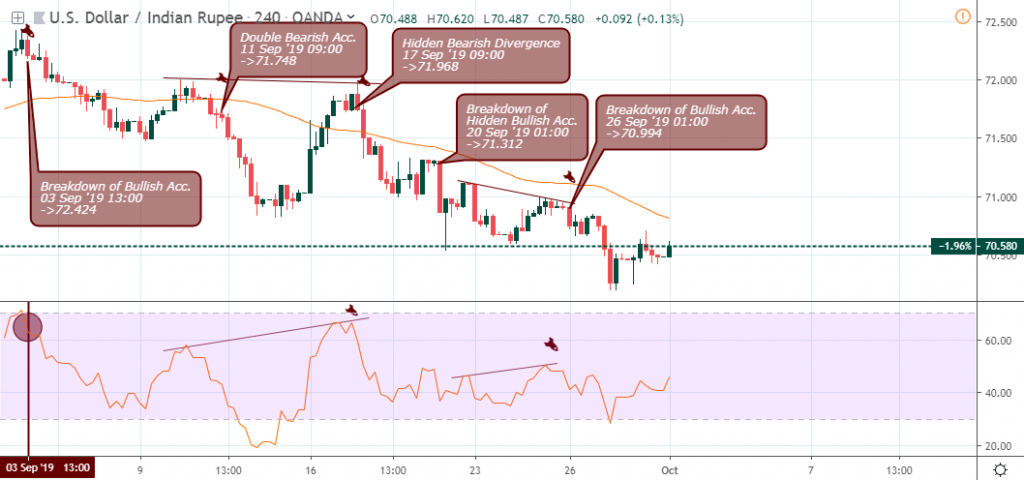
The 4hour time frame reveals the significant entry levels into the bearish trend, starting from a collapse of bullish support on September 03 13:00, followed by two hidden bearish divergence patterns on September 17 and 26.
After a price decline of about 2.12% from the bearish divergence of September 17, the Indian Rupee entered into the oversold area and exits on September 27 13:00. A breakout of critical resistance 70.582 is on the rise, and the USD may resume a price rally.
USDINR 1HR Chart
Zooming way down to the intraday 1hour time frame, the USDINR maintains a bearish parabolic formation. However, the bulls are starting to show strength, as they break above bearish divergence resistance 70.706 at press time.
Conclusion and Projection
The USD to INR trades above its monthly price open after September’s bearish price close. We may be looking at the end of the price correction and perhaps the start of a price rally, not forgetting to look out for any surprise.

No Comments found