USD/INR – Weekly Outlook for October 18 2019
USDINR Forecast & Technical Analysis
Introduction
Trading the USDINR on FBS platforms allows residents to profit from the bullish trend the pair has been in for about ten years now.
In this post, we’ll be looking at the compelling fundamental and technical drivers of the USD to INR currency pair.
India’s Fundamentals
India Wholesale Price Index (WPI) Inflation
India’s WPI is an evaluation of the variation in the cost of goods traded by wholesalers.
The higher the number, the stronger the effect it has on consumer inflation.
A reading that is higher than expected points to positive sentiment for the INR while a lower than expected reading hints at a bearish trend for the Rupee.
The latest data released On September 19th show the previous reading to be 1.08%, while the Actual figure read 0.33% Forecast figure read 0.90% pointing to a bullish outlook for the Indian Rupee.
United States Federal Budget Balance
The Federal Budget Balance is an evaluation of the variation in price between the profit and expense of the federal government within the month in review.
A positive number hints at a budget surplus, while a negative number shows a deficit in the budget.
A reading that is higher than expected points to positive sentiment for the USD while a lower than foreseen reading hints at a bearish trend for the USD.
The latest data released On September 12 shows the Actual figure read -200B while it showed the Forecast figure to be -195.0B steering to a positive viewpoint for the USD.
USDINR Technical Analysis
USDINR Long term Projection: Bullish Swing
USDINR: Monthly Chart

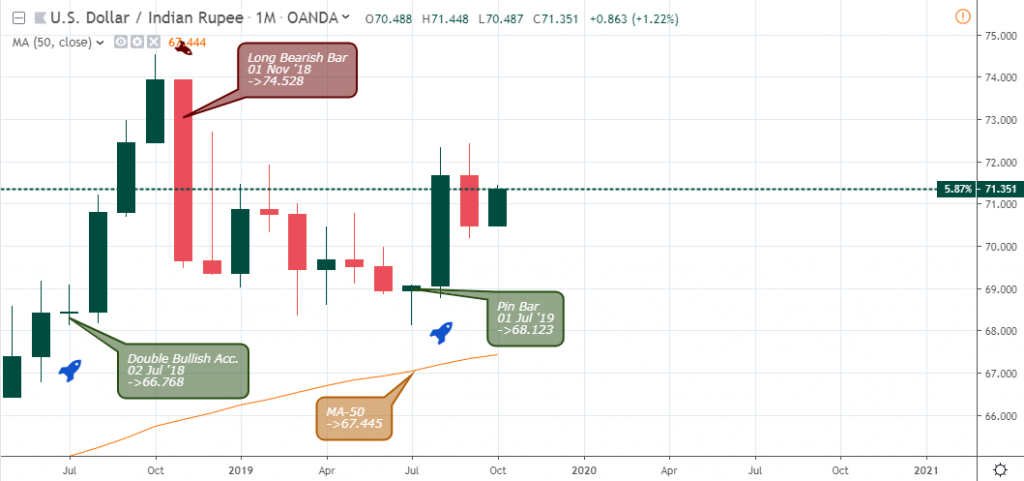
The monthly time frame generally offers a bird’s eye view of any financial market, making it possible to spot big moves quickly. After a correcting the USD gains by roughly 8.5%, the USD to INR resumed a bullish climb from the pin-bar candlestick pattern on July 01.
Upon entering the MA-50 support region, the bears experienced some restraints from the Moving Average, and not too long into the move; the price sprang back in the upward direction.
USDINR: Weekly Chart

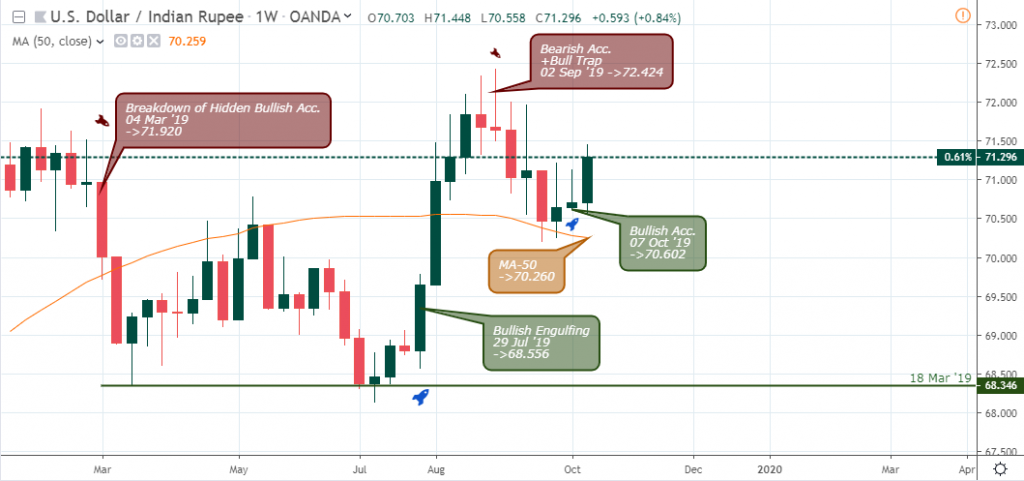
From the weekly time frame, a similar pin-bar candlestick pattern established sound support at 68.346, which is looks impregnable for sellers.
An increase in buying power is reflected as a bullish engulfing candlestick pattern on July 29 after setting support at 68.556.
Notice the change in polarity as the MA-50 first served as resistance on May 13, and offering support on a somewhat recent September 30.
The bullish candlestick pattern on October 07, in combination with the MA-50 support project, a strong rally towards the 73.0 round number level.
USDINR Medium Term Projections: Price Correction (Bullish)
USDINR Daily Chart

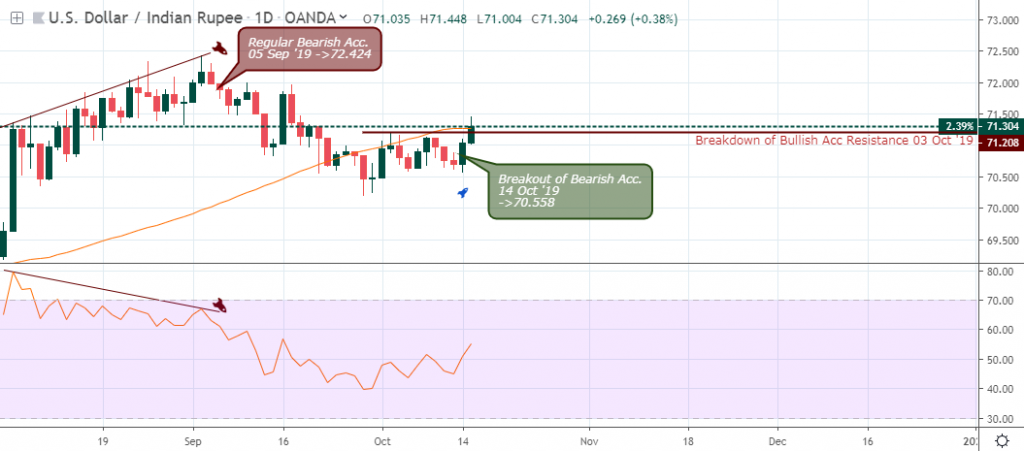
Regular bearish divergence patterns flagged on September 05 started hinting traders that were long the USDINR to begin taking profits. The bears eventually took over the market, forcing a recovery of the Indian Rupee.
The recent close above resistance on October 14 shows strong bullish sentiment, and the price may surge higher somewhere around the 72.00 area.
USDINR 4HR Chart

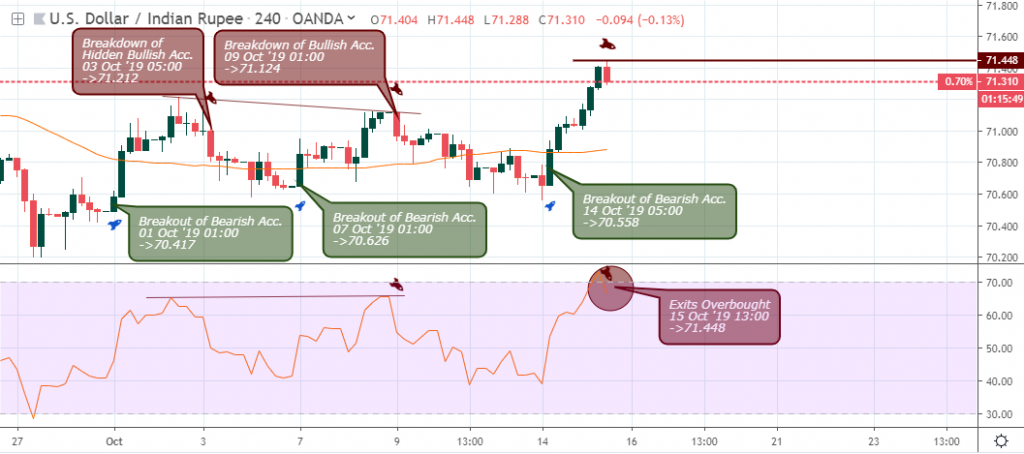
The above 4hour chart shows the pair in a sideways range, as the bulls and bears break beyond crucial support and resistance levels. The above chart shows price breaking resistance on October 01 01:00; 07 01:00; and 14 05:00, respectively.
USDINR 1HR Chart
A combination of regular bullish divergence patterns on October 11 and 03:00, and 14 04:00, forced an upward surge in the USD to INR exchange rate by about 1.0% on the intraday 1hour chart.
A regular bearish divergence at press time led to a slowing of the bullish momentum and possible price decline as the pair trades close to the MA-50.
Conclusion and Projection
The USDINR is on the verge of building consecutive bullish closing bars on the weekly time frame, which is a trend on the daily and 4hour time frame. However, these lower daily, 4hour, and 1hour time frames appear to be in the overbought state, and we may likely see a correction of the price rally towards the end of this week.
No Comments found