USD/INR – Weekly Outlook & Analysis for 15th April 2021
USDINR Forecast & Technical Analysis for Forex
Introduction
On the India forex platforms, you can see that the U.S. dollar has shown a significant surge against the Indian rupee (USDINR) in the past week. It indicates that the U.S. economy is recovering from the impact of the covid19 crisis.
India’s Fundamentals
The Indian rupee has come under pressure as the emerging market banks face pressures from the rising global yields and rising inflation strains in the market from the developed countries. The recreational activities and retailing services dropped by 26% as of recent in India compared to February 24, 2021.
The CPI result of March 2021 shows that consumers’ confidence has fallen. There is a decrease in spending on items nonessential, reported by the Reserve Bank of India.
The vaccine drive by the Indians administration started in mid-January, and they have successfully administered over 100 million doses of the covid19 vaccine as of April 10, becoming the first country to reach that threshold. However, many rural and remote places are yet to be vaccinated as the government runs out of vaccines.
People inoculated are only 25% of age 45 and above in few areas of the urban centers in India.
U.S. Fundamentals
Retail Sales mm
The retail sales data is based on the value of change in the retail levels. It has its focus on consumer spending, which is accounting for the overall economic activity.
A result more outstanding than expected is good for the currency, while a lower outcome is not suitable for the U.S currency.
The U.S. dollar gained over 4% of its loss to the Indian rupee (an emerging market ) from a monthly chart overview during the covid19 pandemic that weakened the currency’s strength. The U.S. massive fiscal stimulus has driven the DYX into the fourth month high as we see the U.S. dollar edge out emerging currencies like the Indian rupees.
USDINR Price Analysis
Monthly Chart Projection: Resumes Uptrend

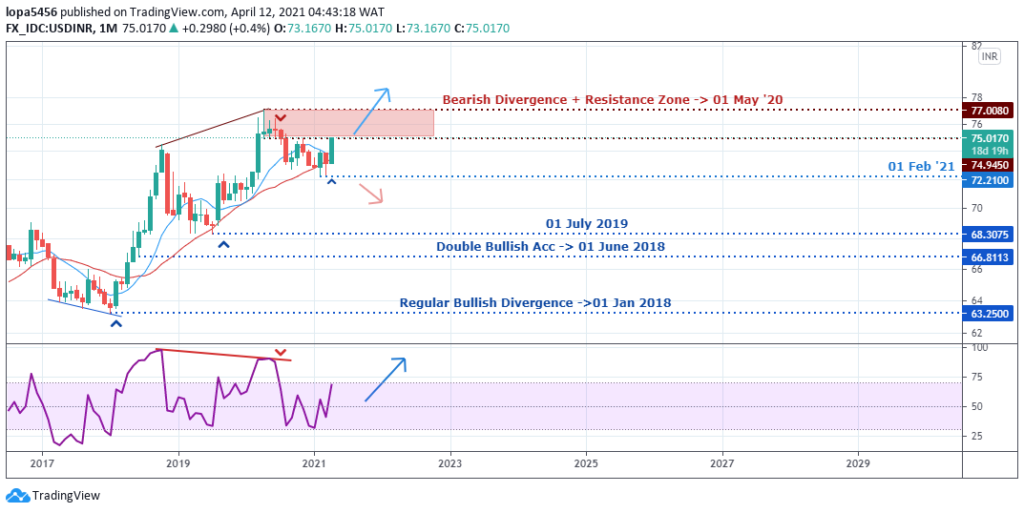
Monthly Resistance Levels: 77..008, 74.914
Monthly Support Levels: 72.210
Our Monthly chart shows that the Indian Rupee has lost momentum against the U.S. dollar as the 72.21 levels acted as support for the U.S. currency, and the Bulls were able to take advantage of the market structure for a bullish surge.
If the bulls rally can close above the resistance of 77.45, we shall call it a continuation of the bullish trend on the monthly time frame, which means that the correction phase is over.
However, if the price should fail to close above the resistance zones, we may see a double top chart pattern forming a trend reversal from bullish to bearish from the zones.
Weekly Chart

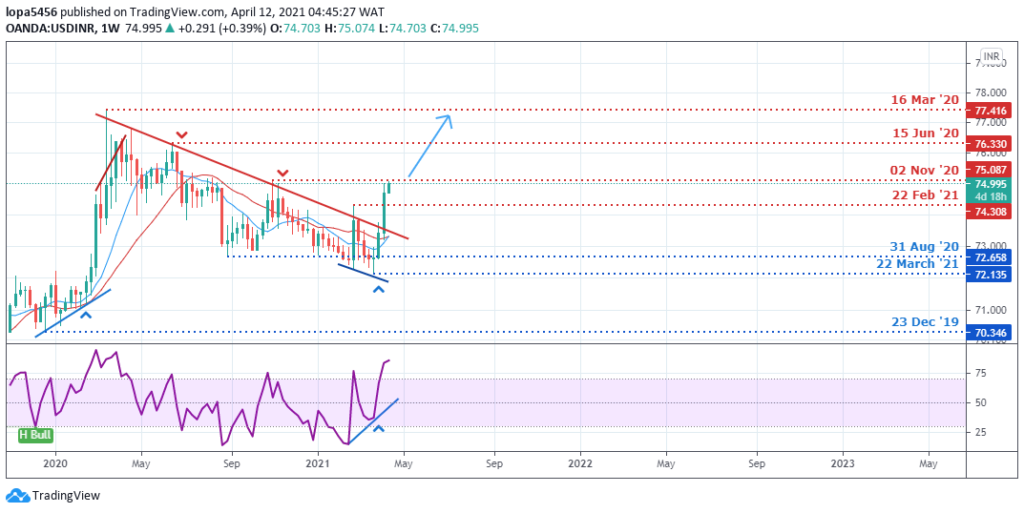
Weekly Resistance Levels: 76.33, 77.416, 75.548
Weekly Support Levels: 72.066, 72.658
The USDINR pair has been bearish for a while on the weekly time frame before the bullish surge broke above the trend line, indicating a possible reversal of the trend to an uptrend on the weekly chart. The bulls need to close above the various resistance levels to enjoy their bullish run on the other hand.
The online broker should expect the U.S. dollar to grow in strength as the economy is recovering from the effects of the covid19 pandemic that crippled the world’s economy having affecting every sector of businesses.
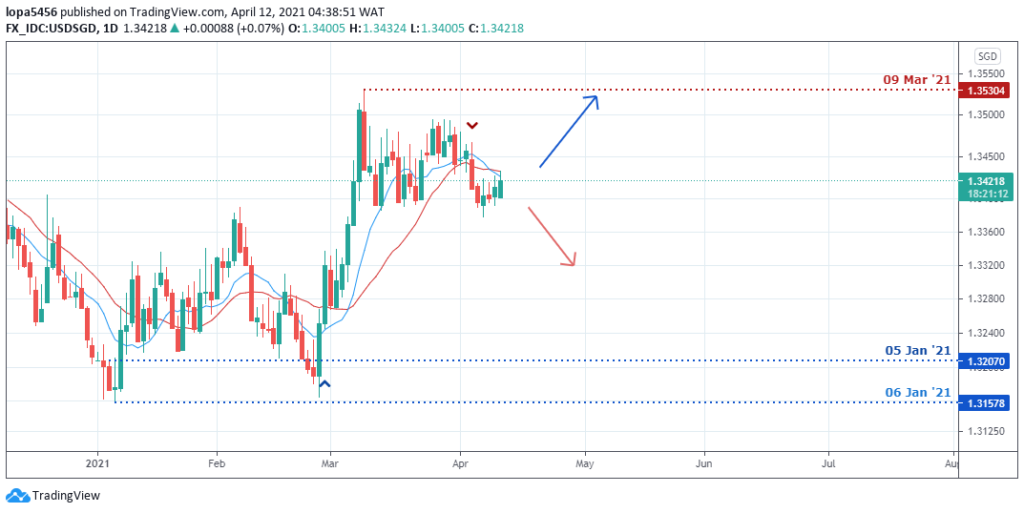
Daily Projections: Breakout of Descending Triangle

Daily Resistance Levels: 76.34, 76.85
Daily Support Levels: 72..28, 73.09, 73.58
The bulls were able to find support around the 72.28 zones with a solid bullish engulfing candle to take over the market from the Bears, and the price has surged higher to the 74.95 zones. We may get a pullback to the 73.70 levels for support if the bullish surge is weakened in days to come or the rally continues to form higher highs.
Bullish Scenario:
The USDINR pair is bullish for the week, and the market has been dominated by the Bulls recently on the weekly time frame; and we expect the bullish trend to continue for some days, having established a support level from the 72.80 levels.
Bearish Scenario:
A bearish scenario on the weekly chart is no longer particular as the bulls have broken the bearish trend line indicating their strength. The short position holders (bears) need the price to close below the support zone of 72.658 to continue the bearish trend.
Conclusion and Projection
A couple of analysts speculate that the rise in the U.S. yields will likely affect the profits of the emerging markets has the market trend is probably going to be bearish for the emerging pairs in the coming months.
Online brokers are likely to take a bearish position as most Asian pairs are on a bearish note since the year began. India’s rupee was one of the best performing emerging currencies last year into the New Year, but it’s likely going to be having a hard time in the coming months among its pairs.
We expect the trend to be bullish for the week as the bull’s pressure is seen on the weekly time frame, having broken the bearish trend line.

No Comments found