USDINR – Weekly Outlook & Analysis for April 16 2019
USDINR Forecast & Technical Analysis for India Traders
Introduction
This week the USDINR and other FX pairs on XM trading platform transition into a new monthly candlestick, and showing strength for the US dollar.
Let’s turn to the time series charts of the USD vs. INR and perform a top-down analysis, identifying the critical support/resistance levels, technical chart patterns, and some fundamental indicators.
India’s Fundamentals
India Interest Rate Decision
The government of a country is responsible for making decisions and taking actions to achieve the countries national economic goals. Such policies undertaken by the country’s monetary authority, the central bank, or government is called Monetary policy.
These policies rely on the correlation between interest rates at which loans can be acquired and the total supply of money. And they determine inflation, economic growth, exchange rates and to a large extent, unemployment.
A reading higher than anticipated means bullish for the currency. In contrast, a reading lower than expected means bearish for the U.S. dollar.
Data released most recently on March 27 suggests that a bearish sentiment is imminent for the INR as the previous and forecast readings are 5.15% while the actual reading is 4.40%.
U.S. CB Consumer Confidence
The United States Conference Board Consumer Confidence Index is an evaluation of the level of trust and confidence consumers have in the U.S. economic activity.
A higher index reading always suggests a higher consumer optimism.
A reading higher than anticipated means bullish for the currency. In contrast, a reading lower than expected means bearish for the U.S. dollar.
Data released most recently on March 31 suggests that a bearish sentiment is imminent for the USD as the forecast reading is 110.0, previous reading read 132.6, while the actual reading is 132.6.
USDINR Price Analysis
USDINR Long term Projection: Bullish
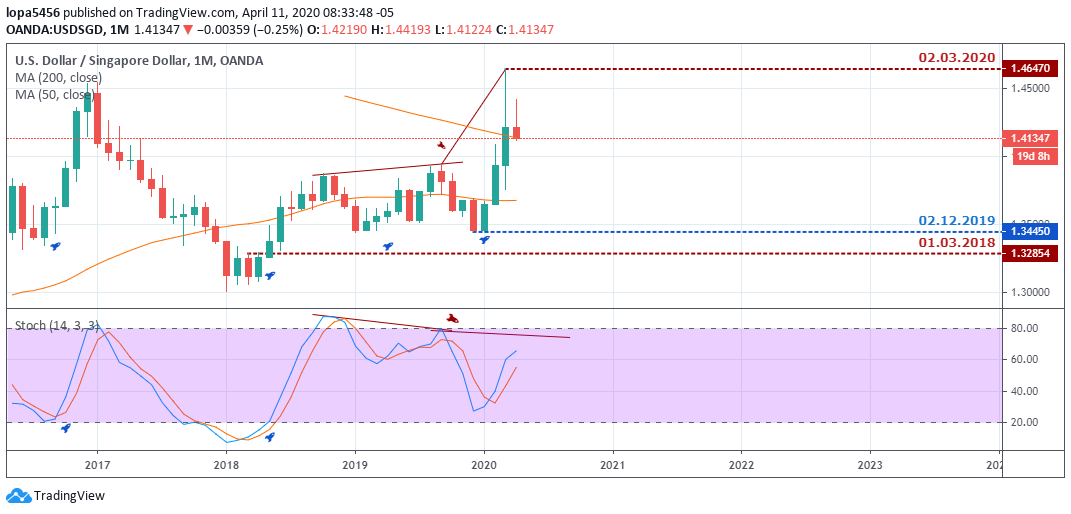
Monthly Chart

Resistance: 77.416, 74.528, 72.322
Support: 63.160, 68.123
We observe a buildup of regular bearish divergence as the USDINR inched into the overbought area in March.
At this level, the general outlook of the USD vs. Indian Rupee is still bullish. However, a view from the lower time frame may suggest otherwise.
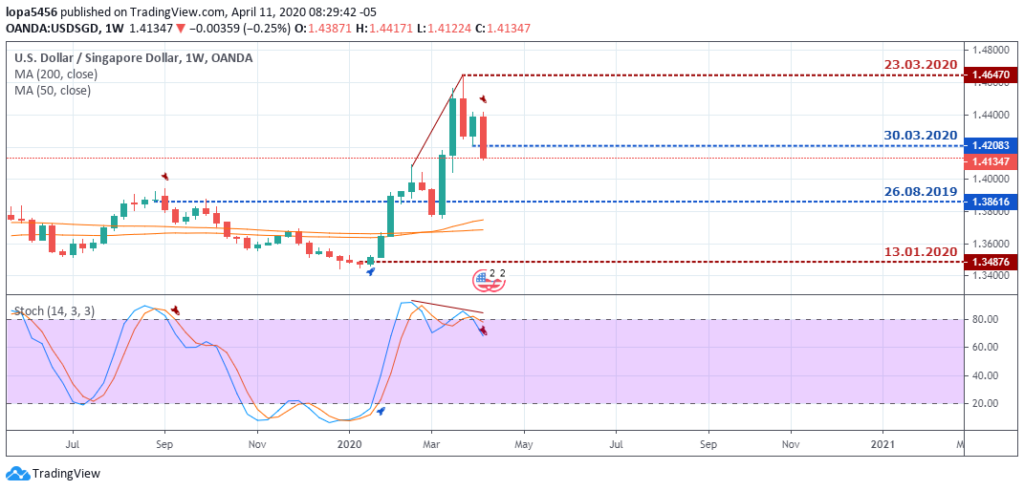
Weekly Chart

Resistance: 77.416, 72.424
Support: 68.123, 70.320, 74.214
Three consecutive weekly closing bars on the chart above confirm an accumulation of buy orders, and setting support at 74.214. This is clearly a bullish signal, although, a collapse of the support would mean a switch in polarity to the downside.
We’ll closely watch the 74.214 support as we enter the new week.
USDINR Medium Term Projections: Bullish with High Volatility
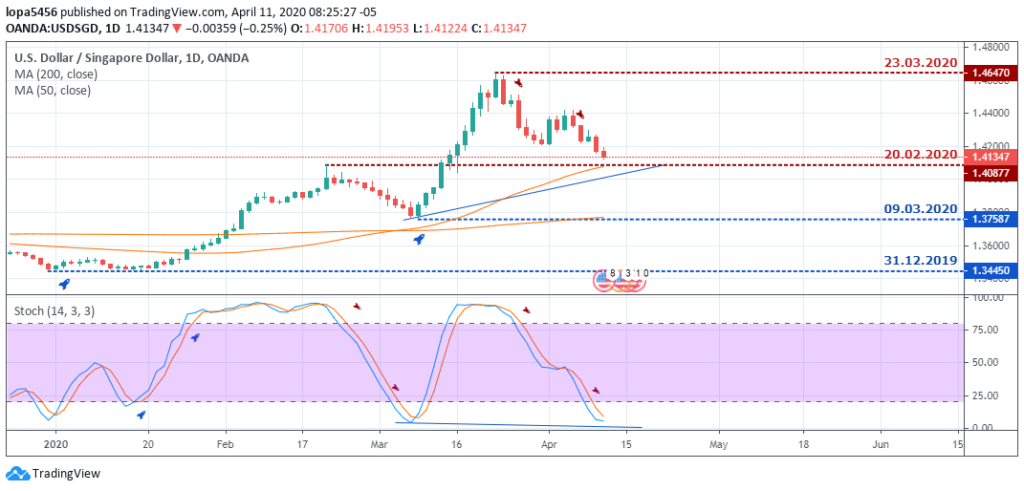
Daily Chart

Resistance: 77.416, 76.28, 74.36, 71.886, 71.314
Support: 70.32, 70.346, 71.073, 71.472, 73.428, 74.214
The bulls struggle to establish a new daily close above the 76.484 resistance, and finally closed bearish last week.
A breach of the significant resistance implies a continuation of the bullish momentum and new highs.
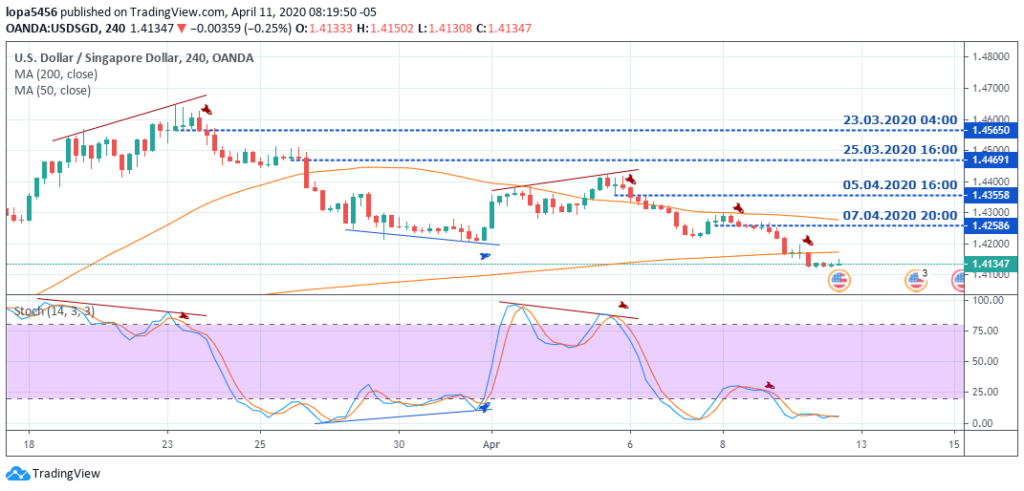
4HR Chart

Resistance: 77.416, 75.502, 74.932, 74.522, 74.232
Support: 73.45, 73.694, 74.214, 74.411, 75.262, 75.368
While trading within a range, an increase in buying power by the bulls force the exchange rate above critical resistance levels set up as accumulation of sell orders on 13 March on the above chart.
Conclusion and Projection
As the race towards developing a vaccine for the corona virus heighten, India records some patients responding to treatment by administering hydroxychloroquine. A permanent solution in the form of a vaccine would mean a comeback in global economies.
We expect a bullish outlook into this week, while paying attention to identified support levels on the weekly time frame.

No Comments found