USD/INR – Weekly Outlook
Weekly Forex Forecast for India Brokers
India is a member of the association of rapidly growing economies known as BRIC countries, as well as a major economy in the G-20. These BRIC nations comprise of Brazil, India, Russia, and China. As a unit, they boast of a rapidly increasing Gross Domestic Product (GDP) compared to Germany and the United States. Though as a unit, the BRIC nations are experiencing a rapid growth GDP, India’s GDP is slowing at the moment, which is based on increasing inflation.
Inflation in India
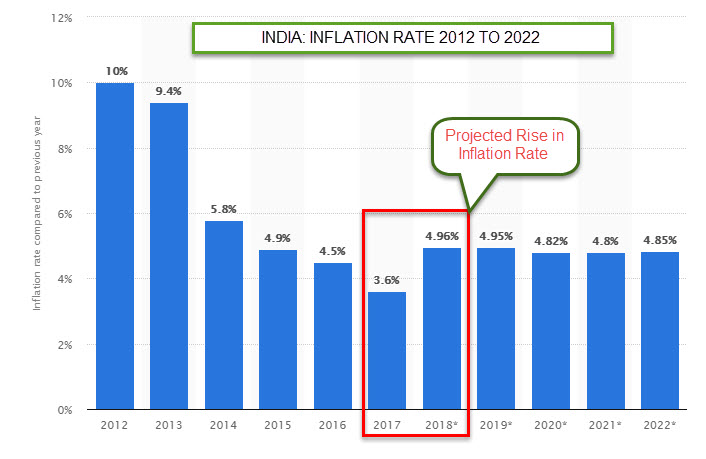
Inflation in India has been on the decline since 2012 into 2017 but projected to be on the rise in the current year and into 2022 as shown in the chart below. This is a negative sentiment for the Indian Rupee as an increase in the Inflation rate of a country means less confidence in the currency by India brokers and traders alike. With this occurrence, most investors who had their holdings converted from USD to INR when the Indian Rupee was stable, will be risk-averse towards the Indian Rupees and hence do an opposite trade.
Unemployment Rate India
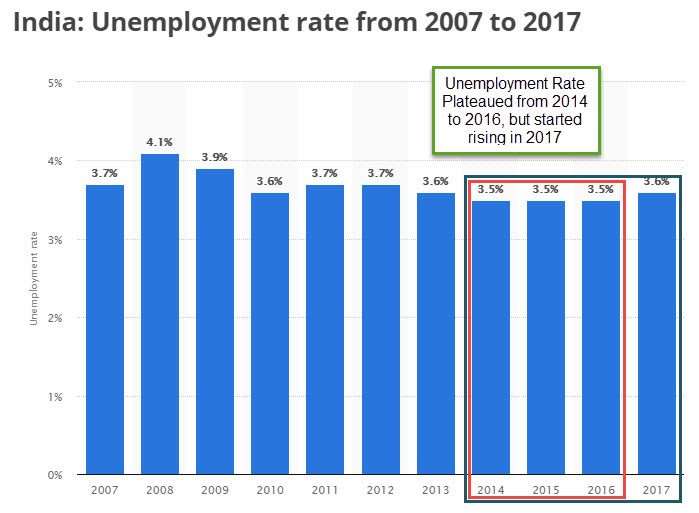
India’s manufacturing industry and her Service sectors are the strongholds of the nation’s economy. However, with rapidly increasing mechanized systems, this is equally causing an increase in unemployment. The nation recorded a huge trade deficit, over the last decade. The implication of this is that the countries import is larger than her export, consequently leading to borrowing money to finance the country. Trade deficit by most economists is considered a negative signal, especially for emerging economies such as India.
Technical Analysis
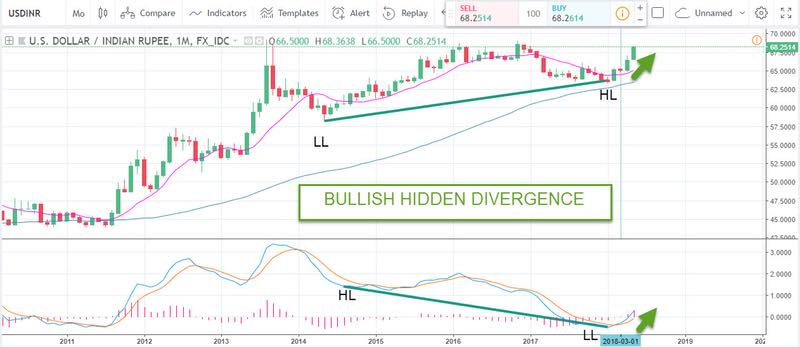
In order to efficiently trade the pair USD vs INR, it is important to analyze the dynamics of the price charts moving from the highest time-frame to our chosen lowest time frames. Zooming out to the monthly timeframe as shown in the above chart, it is clear the pair is in an upward trend, as it trades above the 65-period Moving Average (blue).
A more convincing entry signal into the bullish direction is the bullish hidden divergence pattern that compares the MACD (21, 9, and 5) indicator to the same monthly price chart. Crossover of the MACD above the signal line on 01-03-2018 triggered the bullish run we are experiencing, from a monthly perspective.
USD to INR- Weekly Chart Overview
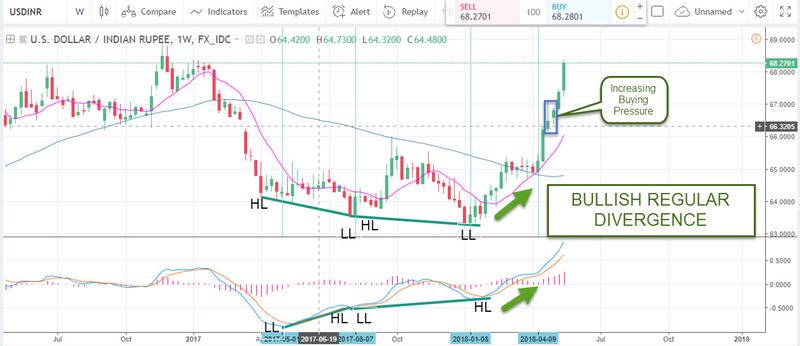
As illustrated in the Weekly chart of the United States Dollar vs. Indian Rupees shown below, we can clearly see the occurrence of a confluent of events. Just around the dates where the Monthly timeframe ushered in a bullish hidden divergence setup, the weekly timeframe also signalled double bullish regular divergence patterns. Last week also triggered a price pattern signalling an increase in buy-pressure.
4-Hour (H4) Time Frame
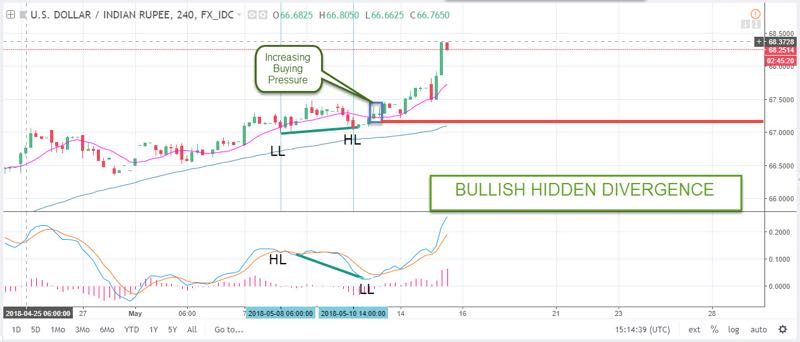
The 4-hr time frame offers a closer look into the most recent happening in the pair which is what most traders is interested in. As shown below, we can clearly see a bullish hidden divergence pattern, triggered around the 11th and into 14th of the current week. With favorable United States intraday fundamentals and a currently increasing unemployment and inflation rates in India, the pair continues to attain new highs.
Projection and Conclusion
This week has been a favourable one for the United States dollar even against major pairs like the EURUSD, GBPUSD, USDJPY, XAUUSD, and USDTRY to mention a few. This indicates a stronger U.S economy compared to the others. The Indian Rupees is not left out of this battering, as we expect this move to continue into the next week. India brokers such as IQ option , Binomo, and Olymp Trade are a few brokers I’ll like to recommend for trading the USDINR. Reason being that these brokers have great customer support for Indian traders and a free demo.
Top 3 Brokers to trade USD/INR


No Comments found