USD/INR – Weekly Outlook for December 5 2019
USD/INR Forecast & Technical Analysis
Introduction
Over the last four weeks, the Indian Rupee has suffered a battery from the USD on IQ option broker offering the pair to their pairs. You may want to check out our broker section for a list of such brokerages.
In this post, we take a look into the underlying fundamentals and technical chart patterns driving the USDINR Forex pair.
India’s Fundamentals
India Interest Rate Decision
Monetary policies are actions undertaken by a country’s central bank, monetary authority, or government to achieve distinct national economic purposes. These systems are built on the relationship amid interest rates and the total supply of money.
Policy rates are the most vital rates within a country’s monetary policy, and a change of policy rates influences economic growth, unemployment, inflation, and exchange rates.
Traders can expect a bullish sentiment for the INR when data reading is higher than anticipated, while traders can expect a bearish trend if the data reading is lower than forecasted.
With data released October 04 showing actual and forecast reading at 5.15% and previous reading at 5.40%, we can expect a positive sentiment for INR.
U.S. Factory Orders
Factory Orders evaluates any variations in the total value of new purchase orders placed with manufacturers.
Traders can expect a bullish sentiment for the USD when readings are higher than anticipated, while traders can expect a bearish trend when the readings are lower than forecasted.
With data released November 04 showing actual reading to be -0.6%, previous reading to be -0.1%, and forecast reading to be -0.5%, we should anticipate a bullish sentiment for USD.
USD/INR Technical Analysis
USDINR Long term Projection: Bullish Swing
Monthly Chart

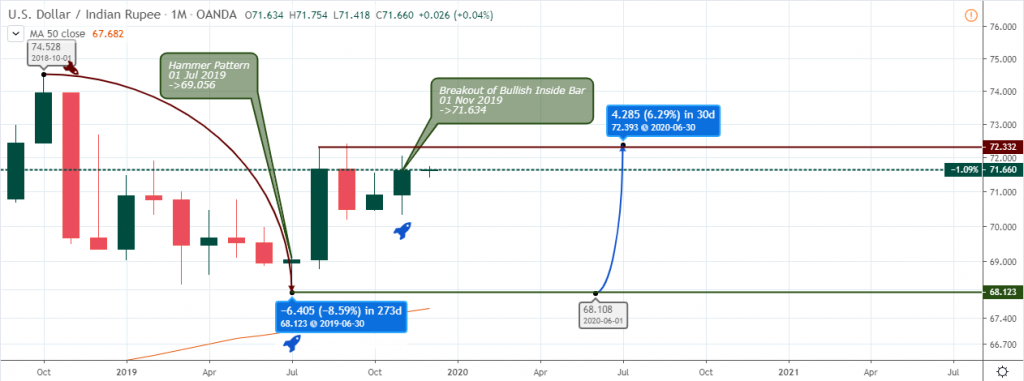
Bouncing off the 50-monthly Moving Average, the USDINR confirmed an end to the eight-month correction with a hammer candlestick pattern on Jul 01 ’19.
Moving forward, the greenback closed above a bullish inside-bar price pattern on Nov 01 ’19 threaten further price increase above the Aug 01 ’19 high.
You may want to place your stop-loss order at a safe distance below the 68.13 pin-bar support as the level coincides with the MA-50, indicating further weakness of the Indian Rupee.
Weekly Chart

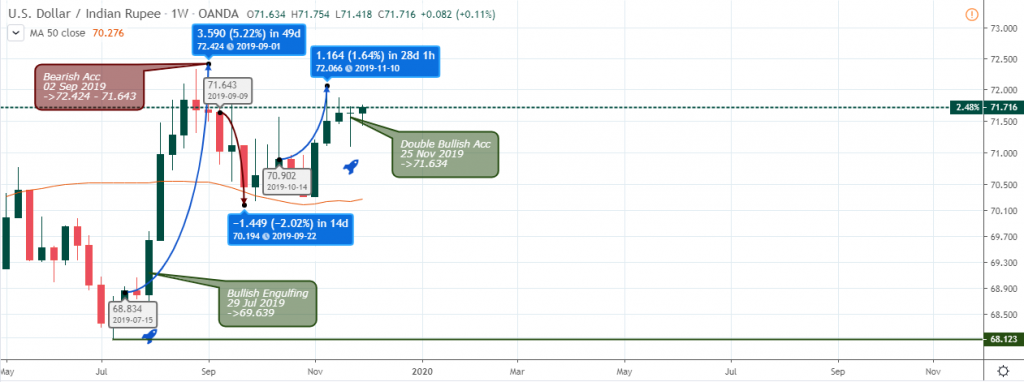
Taking a look at the weekly chart above, the USD to INR exchange rate after the July 20 ’19 bullish engulfing pattern, skyrocket by about 5.22% before signaling accumulation of sell orders.
After a price correction of about 2.02%, the pair made a move similar to that of the monthly time frame bouncing above the MA-50 on Sept 22 ’19.
So far, the bulls are pile up buy orders on Nov 25 ’19, getting ready for a further price rally. Could this be a slowing in price as a result of the bearish resistance 72.424 on Sep 02 ’19? Let’s find out on the lower daily time frame.
USD/INR Medium Term Projections: Price Correction (Bullish)
Daily Chart

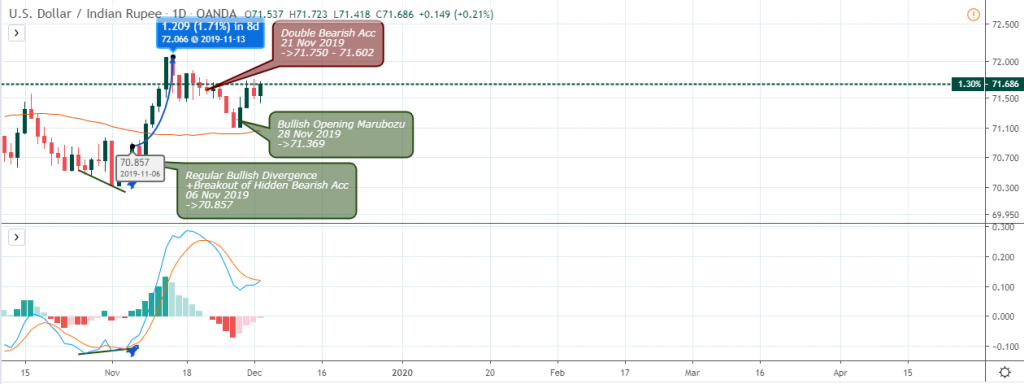
The 50-period Moving Average across multiple time frames have so far proved to offer solid support for a price rally.
A bullish opening Marubozu price pattern on Nov 28, 2019, was the first entry signal into an extended position.
We move to the 4hour time frame for clarity into the price buildup. Perhaps we may find more clinical long/short entry setups.
4HR Chart
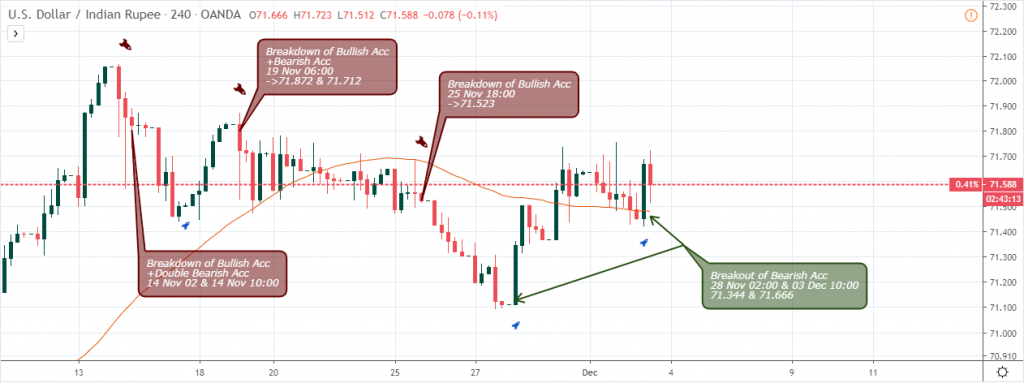
Here on the above 4hour chart, we get low-risk entry setups, starting with a price close above bearish resistance on Nov 04 ’19 02:00.
With stop loss placed below the 70.314 support, the USDINR price surged by about 2.24%, a 6.33 Reward: Risk.
Going forward, we projected that the 0.78% price drop should coincide with the MA-200, and recoil back to the upside. Let’s see how that plays out in the updated chart below.
Here on the above 4hour chart, we get low-risk entry setups, starting with a price close above bearish resistance on Nov 04 ’19 02:00.
With stop loss placed below the 70.314 support, the USD/INR price surged by about 2.24%, a 6.33 Reward: Risk.
Going forward, we projected that the 0.78% price drop should coincide with the MA-200, and recoil back to the upside. Let’s see how that plays out in the updated chart below.

Conclusion and Projection
The market outlook favors a bearish trend from a short term intraday perspective. However, we lean toward a bullish trend in the long term.

No Comments found