USD to INR – Weekly Outlook ( June 30, 2018 )
Weekly Forecast for Forex Brokers
Introduction
The last time we did a review on the USDINR, we saw a strengthening U.S dollar and issues in the Indian banking sector. Well, in more recent weeks, other fundamental factors have equally contributed to the weakening of the Indian Rupees. Read on as week take a look at the fundamental and technical price action patterns affecting the USDINR currency pair.
Fundamental overview of the U.s dollar and the Indian Rupees
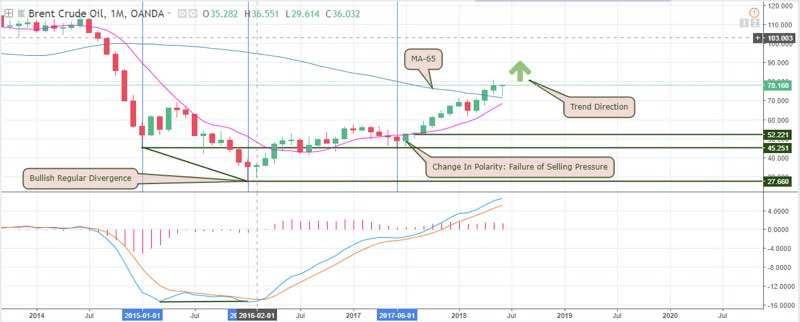
India being the third largest consumer nation of oil is having it hard, as the price of oil grows higher. Oil is priced in U.S. dollars, and as a result of this, more Indian Rupees is required in oil transactions, hence a devaluation of the Indian Rupees. This consequently leads to increasing inflation to basis points of about 30-40. As oil prices rise higher, and the U.S dollar wax stronger, most investors tend to move their funds away from emerging markets.
Moving to the United States, President Donald Trump withdraws his stands on “trade wars” which was trending last week. Trump is now in favour of the U.S Treasury secretary’s approach to trading with China, which is believed to be less confrontational. This move resulted in a slight boost in value of U.S stocks, and the USD.
Technical Analysis
Most professional traders and Forex brokers pay attention to price action patterns for clear entry and exit signals. Such patterns are the divergence patterns, Classical / irregular inside bar patterns, and harmonic patterns. Let’s start our pattern/ price action analysis form the highest time frame and gradually zoom into the lower time frames using some of these patterns as tools.
USDINR Monthly Chart

The monthly chart above illustrates a bullish hidden divergence triggered on March. This was followed by consecutive bullish candlesticks. Based on our multiple time frame analysis, the above consecutive chart indicates that the subsequent lower time frames should follow a particular pattern. The weekly chart should establish a Heiken Ashi chart trend setup with no oscillation; Daily, 4-hour and 2-hour chart would display an oscillatory variant of the same price charts.
USD to INR Weekly Chart
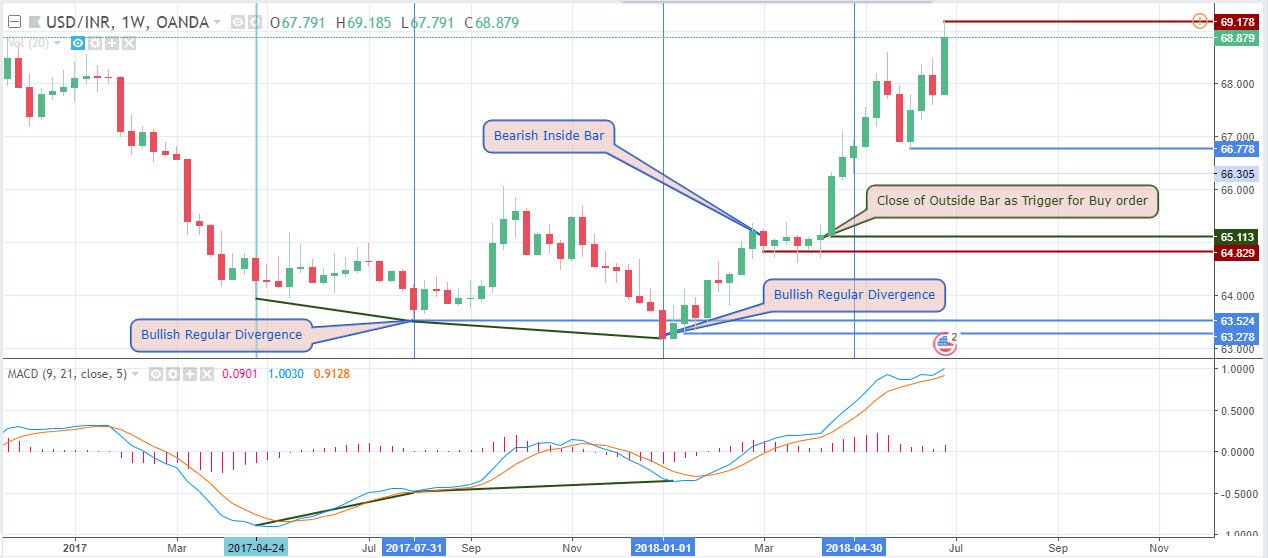
As mentioned in our multiple time frame structure explained in the monthly chart section, we can clearly see that price is in a bullish trend with no oscillation. This trend commenced after the formation of double regular divergence patterns triggered on 01-01-2018 which coincides with the hidden bullish divergence pattern on the monthly chart.
USDINR Daily Chart: Bullish Divergence
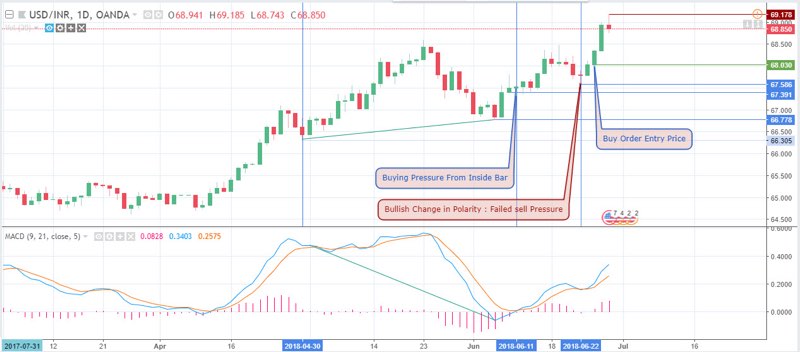
The daily chart shows more oscillations and intermediate trend manoeuvres. On the 11th of this month, the pair establishes buying pressure patterns which saw the pair attain new highs. Failure of selling pressure leads to a bullish change in polarity on 22-06-2018, moving the pair into a series of consecutive bullish candle bars. The pair closes above its highest high of 23-05-2018 clearly indicating the huge weakness of the Indian Rupees.
4-Hour (H4) Time Frame
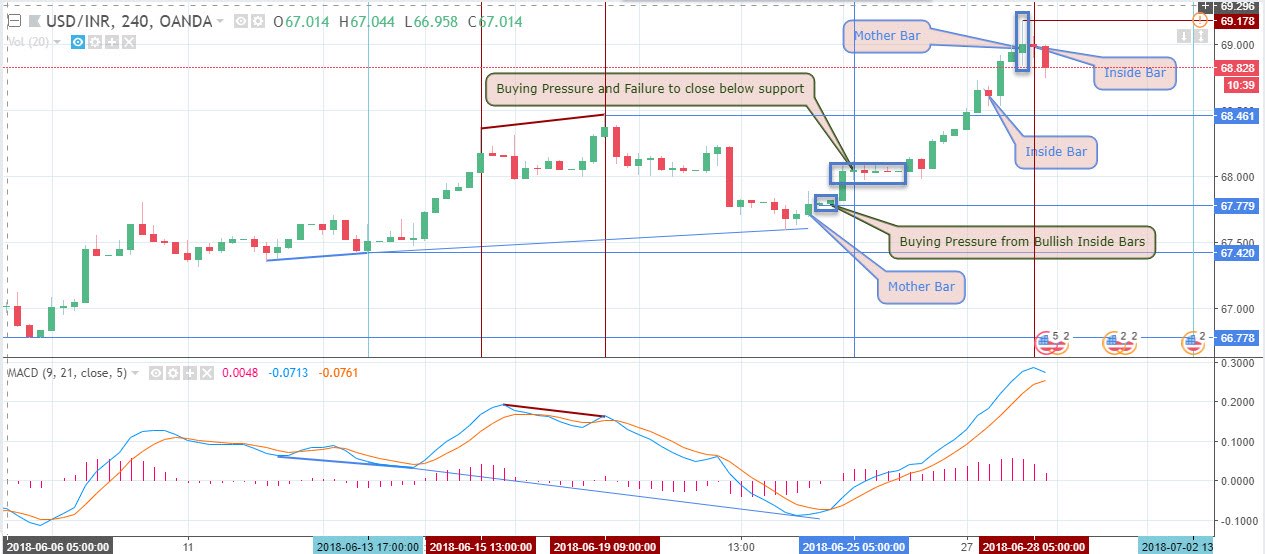
Last time we took a look at the 4-hour chart with a buy direction on the pair. The pair rallied immediately. Following our multiple time frame concept explained in the technical analysis introduction, the above chart shows the oscillatory nature of the pair. A regular bearish divergence triggered a selling pressure on the 19th of June, leading to a retracement of the bullish gains of the U.S dollar. Buying pressure later followed the bullish hidden divergence pattern resulting in the consecutive bullish candle on the 4-hour chart.
2-Hour Time Frame
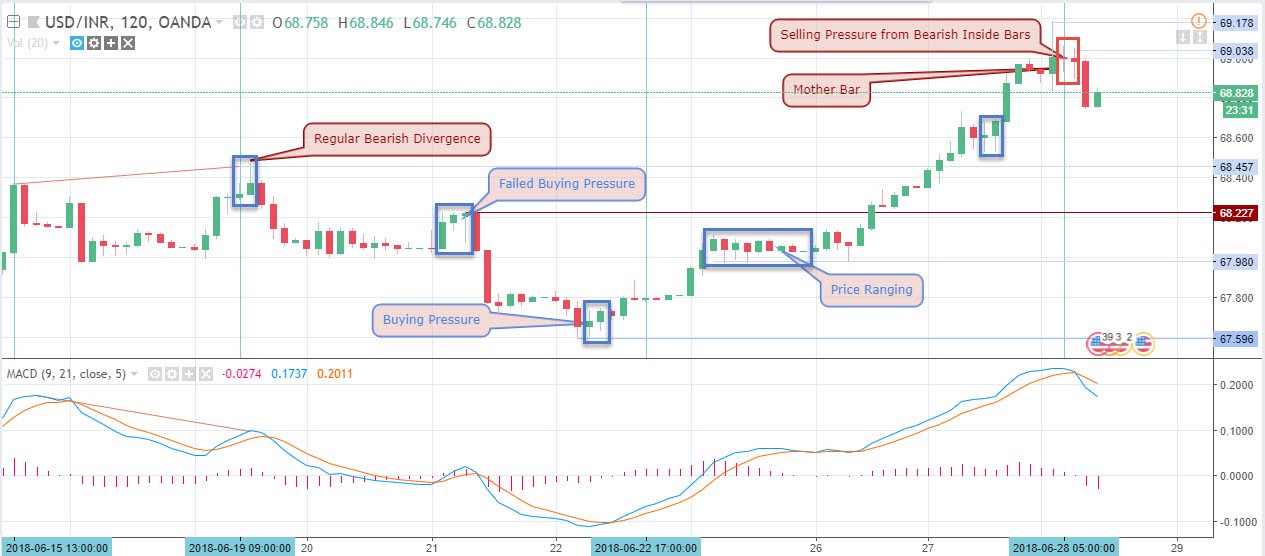
The 2-hourly chart gives a close-up shot of the pair. The above chart shows setups of bearish divergence and followed by bullish accumulation phase that rallied the pair to its current high. Currently, the pair shows bearish selling pressure that might result into another correction of the bullish run.
Projection and Conclusion
As the week winds down to a close, the pair retraces its bullish rise. Moving forward, given that the pair has recently closed above its weekly high, the current bearish move is merely a correction, and USD to INR exchange rate should continue in a bullish trend from a weekly chart overview. Making reference to the Brent oil chart in the article opening, as oil price close above the 65 periods moving average, the Indian Rupee may plummet further.
Top 3 India Forex Brokers to trade USD to INR


No Comments found