USD/INR – Weekly Outlook for October 31 2019
USD/INR Forecast & Technical Analysis
Introduction
The USDINR on Binomo websites bounce off the critical MA-50 from a monthly time frame and shows a stronger USD.
In this post, we move on to analyze technical chart patterns starting from the weekly time frame and down to the intraday charts. We’ll also touch on a few news events that we believe to be worth a mention.
India’s Fundamentals
India M3 Money Supply
Monetary aggregates, or money supply, is the amount of currency available within the economy to be used for purchasing goods and services.
It is a gross monetary sum that includes all tangible money flowing in the economy of a nation, which contains coins and banknotes. It also includes funds in savings and current accounts, central bank functional deposits, deposits of the money market, certificates of deposit, and all other securities.
A reading that is greater than the forecast data reading should be considered as a positive sentiment for the Rupee, while a data reading less than the expected forecast should be deemed as bearish for the currency.
As per the latest data released on October 9, the previous reading was 9.7%, while actual reading was 10.1%, signaling a positive for the INR.
U.S. CB Consumer Confidence
Conference Board (CB) Consumer Confidence is an evaluation of the level of trust consumers have in the economic activity of a country. The indicator can be used to predict consumer spending, which is a crucial player in the overall health of the economy.
Higher data figures point to higher optimism amongst consumers.
A reading that is greater than the forecast data reading should be considered as a positive sentiment for the USD, while a data reading less than the expected forecast should be deemed as bearish for the currency.
As per the latest data released on September 24, the previous reading was 134.2, while the actual reading was 125.1. The Forecast reading was 134.1, signaling a bearish or negative sentiment for the USD.
USD/INR Tecnical Analysis
USDINR Long term Projection: Bullish Correction Phase
Weekly Chart

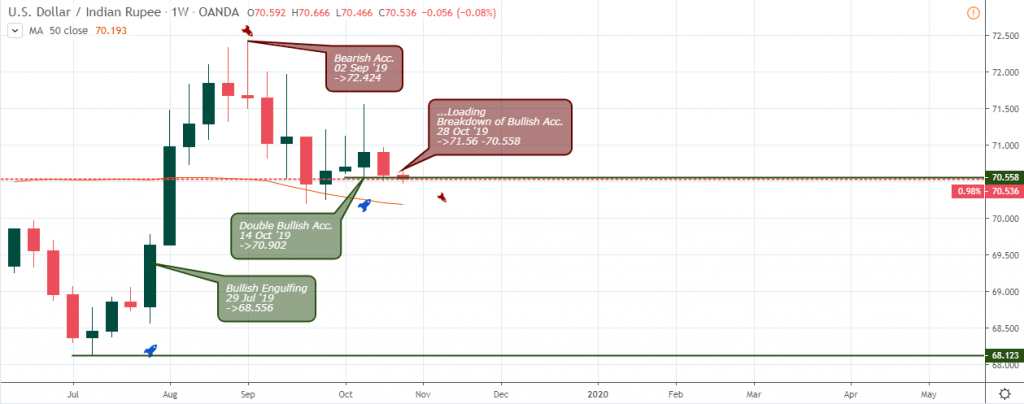
Dropping from a height of 72.424, the USD to INR exchange rate trades above the MA-50, and at the same time, an increase in buying power on October 14. Last week’s bearish closing price, however, seems to undermine the 70.558 support, which may eventually result in a sudden increase in demand for the Indian Rupee.
Below we go on to analyze the lower time frames for more insights into the trend direction.
USDINR Medium Term Projections: Bearish
Daily Chart

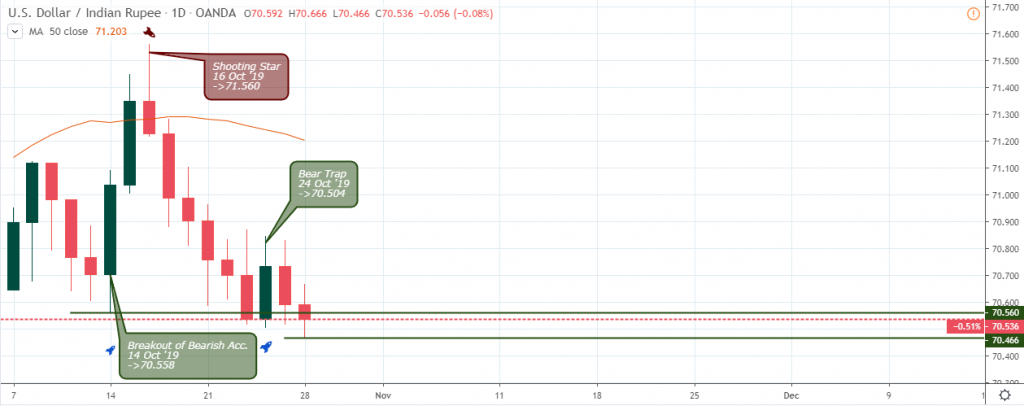
The bullish closing price on Thursday, October 24 ’19 confirms a bear-trap price pattern. However, the bearish closing candlestick on Friday 25 ’19 appears to be a shakeout, taking out the bulls with low confidence in their long position.
Bullish momentum is on the rise at press time, threatening a price close above 70.66 resistance. If it gets confirmed at the close of the day, we may likely see a series of bullish closing bars on the daily time frame.
4HR Chart

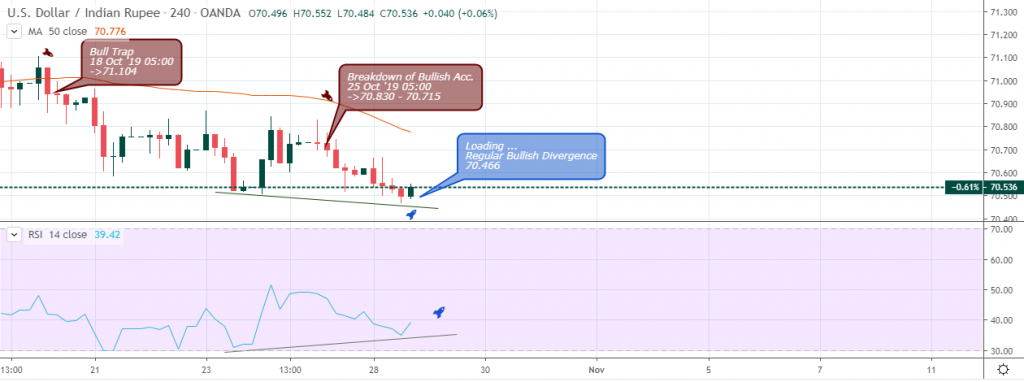
A regular bullish divergence pattern is flagged on the 4hour horizon, after a bull-trap signal got triggered on October 18. We look forward to an increase in the USD/INR favoring the Greenback.
The 50-period MA holds back further increase in the exchange rate at press time. If the bulls succeed to force a close above the level, we should see a further price hike.
1HR Chart

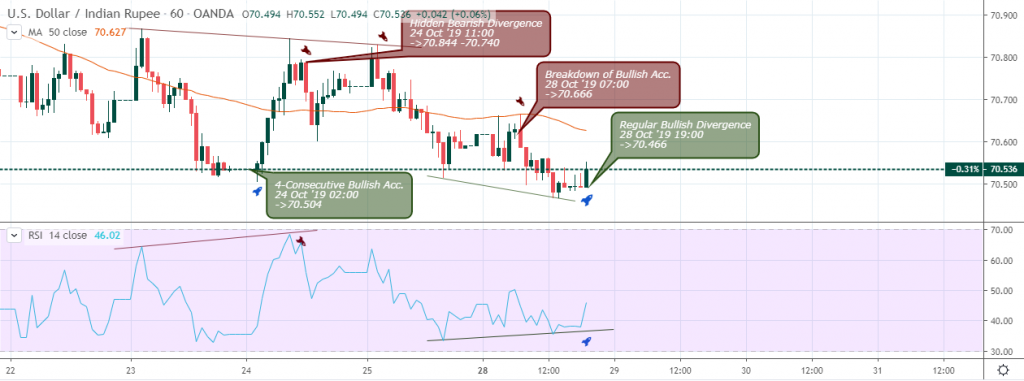
An intraday view shows price trading within bearish and bullish trend lines setup by hidden bearish and regular bullish divergence patterns on October 24, 11:00, and October 19:00.
Conclusion and Projection
The long term trend perspective of the USD/INR is on the weekly time frame. The support level 70.588 established by the bulls on October 14 ’19 is the only obstacle in the path of a strong Indian Rupee.
A breach of this level confirms the stronger Rupee; otherwise, we should look out for an upward surge in the exchange rate.
No Comments found