EURUSD – Weekly Outlook for 25th February 2021
EURUSD Forecast for Forex
Introduction
Market analyst at OlympTrade OlympTrade believes that the equities market’s recent events are more of a fluctuation than a top out of the stock markets, which he considers the bulls will come in and buy the dips.
Tesla shares slumped owing to a 12.1% plunge in the BTCUSD after the electric car manufacturer invested 1.5 billion USD in the crypto-asset.
The DE10YT – 10-year Bund yield resumed its current bullish trajectory, while the US10YT 10-year US Treasury note slumped by one basis point.
Read on for more fundamental and technical insights into the EURUSD traded on forex platforms.
EURO and USD News
According to Barclay’s head of economic research, Christian Keller, a decline in COVID-19 infection rate lead to a steep slope of yield curves, ahead of a significant and likely US stimulus package.
This week, the Feds’ Chair, Jerome Powell, gives his semi-annual testimony before Congress, with the likelihood of reiterating a responsibility to keep policy super-easy, consequently driving inflation higher.
ECB President Christine Lagarde was expected to give a dovish speech on Monday.
Treasury notes 10-year yields gained 1.38%, breaching the 1.3% psychological level, binging the gains to 43 basis points this year.
The GBP surged and set new highs this year following the rapid rollout of COVID-19 vaccines bringing the GBP against the US dollar to trade at a high of 1.40848.
Paired against the Euro, the GBP also dominates for roughly eleven weeks now, bringing the EURGBP exchange rate to 0.86319.
Bitcoin price slumped by roughly 17% across crypto exchanges following an impending regular bearish divergence on the weekly time frame.
Commodity-based currencies like the AUD and the NZD have seen a boom from increasing metal and oil prices.
The DXY USD Index slumped by 0.315%, while the Euro gained 0.41% against the USD to trade at 1.2167 at press time.
The GCv1 US Gold futures gained 1.7%, while Bitcoin slumped by 6.7% at Monday open.
EURUSD Technical Analysis
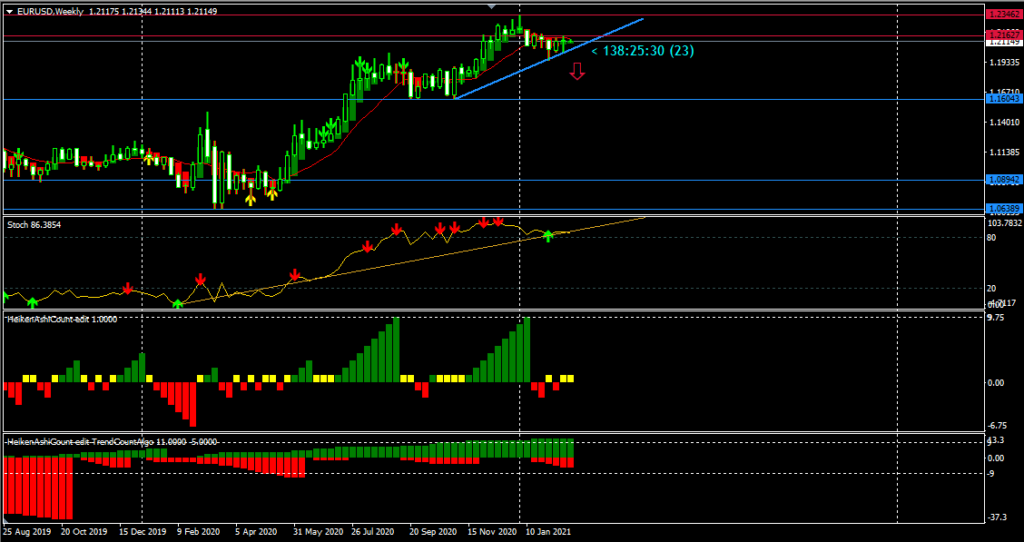
Weekly Chart Bullish and correcting

Weekly Resistance Level: 1.23482, 1.21791, 1.21819
Weekly Support Level: 1.19513, 1.20223
Looking at the EUR vs. USD dollar from a weekly chart overview reveals that it’s in a correction phase, as the bearish Heiken Ashi bars (red) on the second indicator sub-window have not yet made it to three consecutive red bars.
However, the stochastic trend indicator (first sub-window) shows a slowing of bullish momentum, and we should not get caught off guard by a price slump.
A weekly bar close below the bullish trend line should confirm a decision to short the EURUSD in the mid-term.
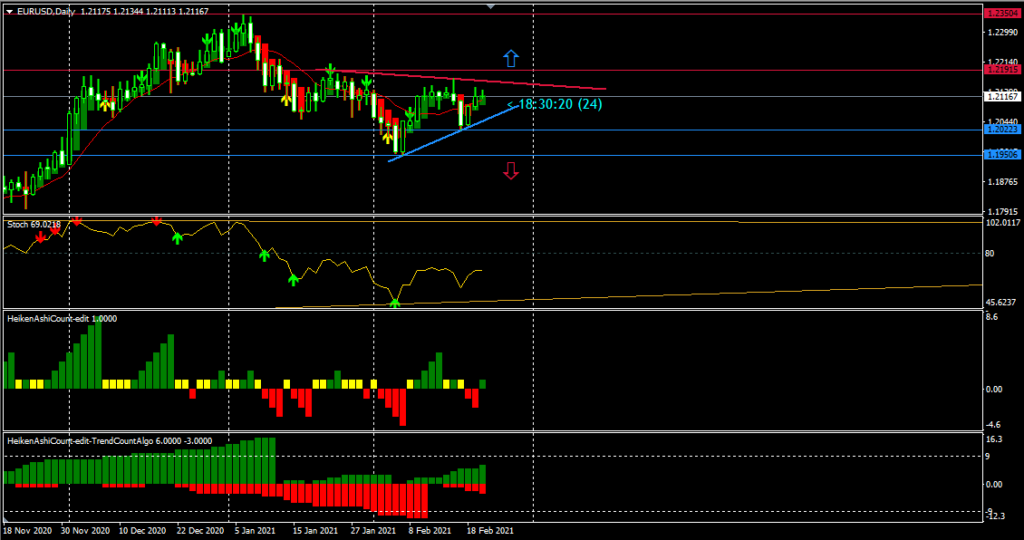
Daily Chart Projections: Descending triangle

The daily chart shows rejection of buy zones on 2021-01-25, 2021-02-01.
After the price slump, the bulls quickly regain control forcing the EURUSD to trade in a somewhat descending triangle.
At this point, a price breakout or breakdown of either the bearish trend line or the bullish trend line would hint the likely direction as we advance.
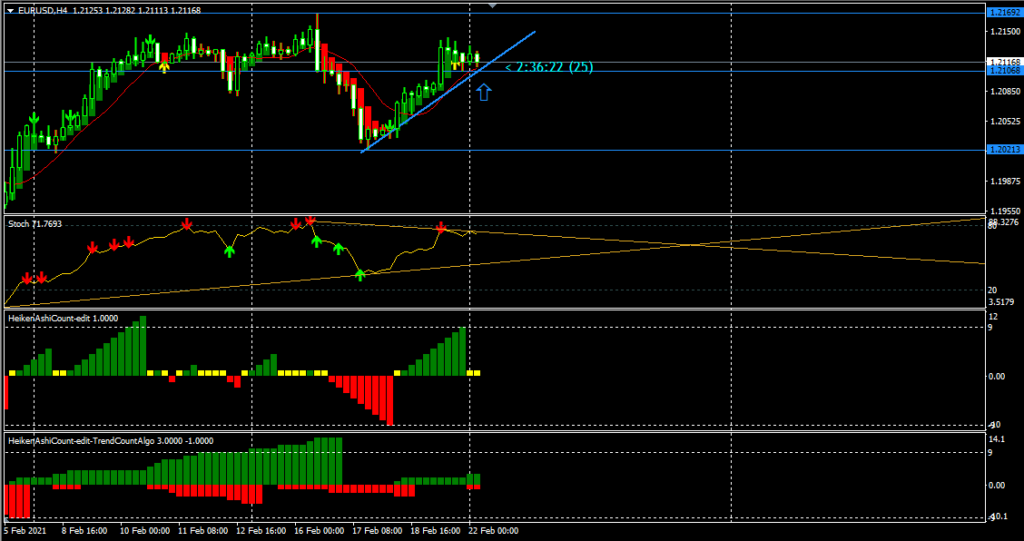
EURUSD: H4 Intraday Chart Overview

The chart screenshot above shows the EURUSD in a correction phase and getting set to resume the up move.
The price increase did occur with the EURUSD rising to 1.21791 and building up a bearish divergence set of the Heiken Ashi count at press time.
We’ll consider scalping into a price increase as the pair is still in a correction phase and look into shorting as soon as the bearish divergence is confirmed.
Conclusion and Weekly Price Objectives
Jerome Powel’s statement before the US SBC – Senate Banking Committee to keep policies in place and focus on restoring the American workforce indicates that the economy is way behind in attaining its inflation goals.
We should expect the EURUSD exchange rate to hover within the resistance and support levels, and the COVID-19 fiscal stimulus package may inject volatility into the EURUSD exchange rate.

No Comments found