EURUSD – Weekly Outlook for 12th November 2020
EUR to USD Forecast for Forex in India
Introduction
The US election has come, and the winner is Joe Biden, a Democrat, which means that some policies will change during the new administrator.
Indian Traders, investors, and other instructions will want to know how it will affect their business, looking at the forex platforms in India.
Fundamentals
Euro Zone
German Final CPI m/m: Forecast 0.1% previous 0.1%
The CPI report is of interest to traders and investors as they measure the changes in the prices of services and goods consumers purchase. The diastasis releases the report every 11th day into the new month, and this is the Final after the preliminary release.
A higher result than the forecast will be a bullish move for the Euro, while a lower than expected report will be a bearish move for the currency.
The U.S.
Prelim UoM Consumer Sentiment
Forecast 82.1, previous 81.8
These surveys are carried under 500 consumers who are asked to rate their economic conditions and future outlook.
If consumer spending is to rise, financial confidence will have to increase. If the data released is greater than the forecast, it is suitable for the U.S. dollar, while a lower result will mean a weak currency.
EUR vs. USD Bigger Picture: Upward Trend
EURUSD Technical Analysis
Monthly Chart

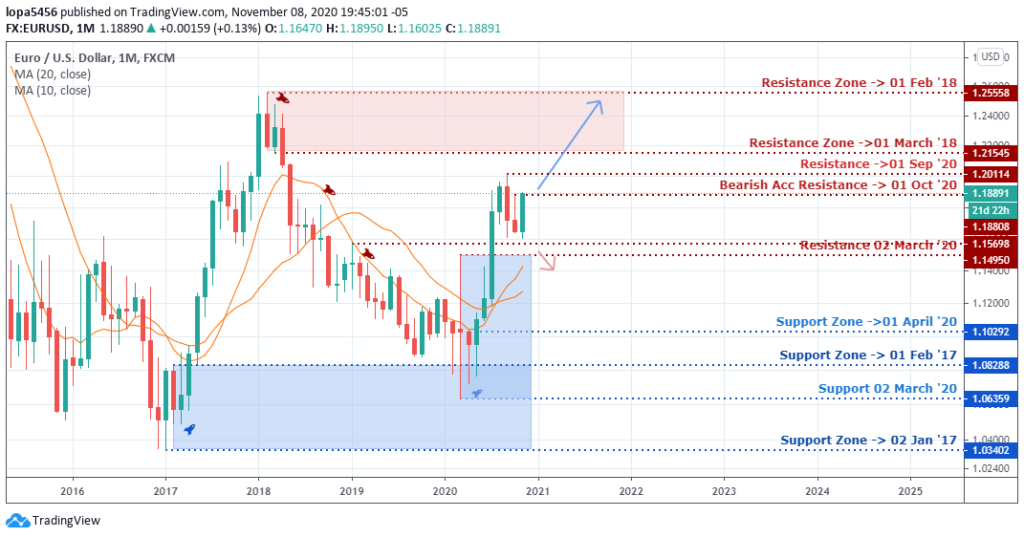
Could the bullish trend be ready for another powerful swing to the upside after resting for a while?
The support levels of March 2020 (1.15698) became a stronghold for the bulls to take the price high towards the resistance zones of September 2020 (1.20114), and we may likely see the bullish momentum continue beyond the 1.21545 levels.
A failure from the bulls will mean that the bears can push back the price down to the support level of 1.15698.
Weekly Chart Bullish

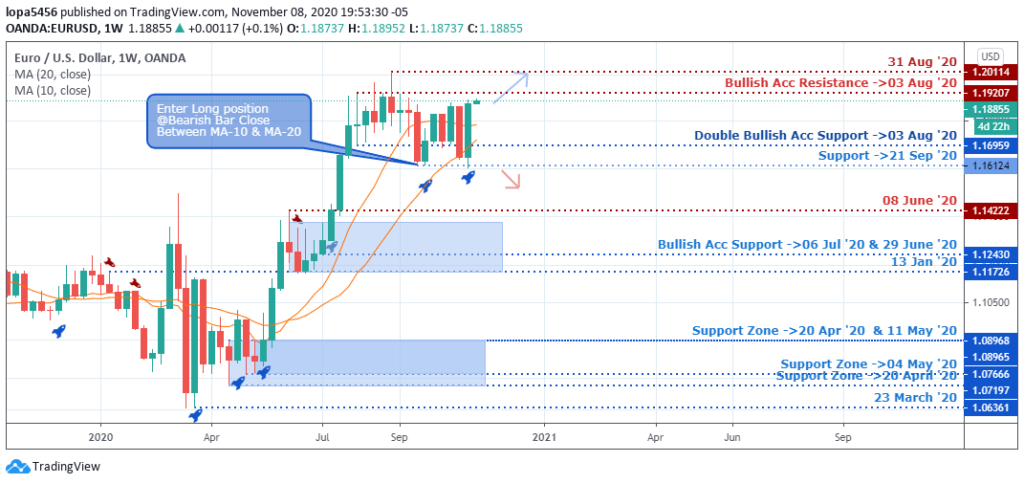
Weekly Resistances: 1.9207, 1.20114, 1.14222
Weekly Supports: 1.16959, 1.11726
The forex platform for the EURUSD pair is in an uptrend on the weekly time frame, and the trend is building momentum as the bulls were able to push the price higher from the 1.16959 levels where the moving average acted as a support for the bulls.
Investors and other institutional traders will closely observe the new week as they expect the bullish move to surge higher above the 1.19207 levels.
The Resistance levels of August 2020 (1.20114) had been a tough place in the past. Can it still reject the bull’s rally again? The answer would be revealed as the week unfolds.
EURUSD Mid-Term Projections: Bullish Consolidating
Daily Chart

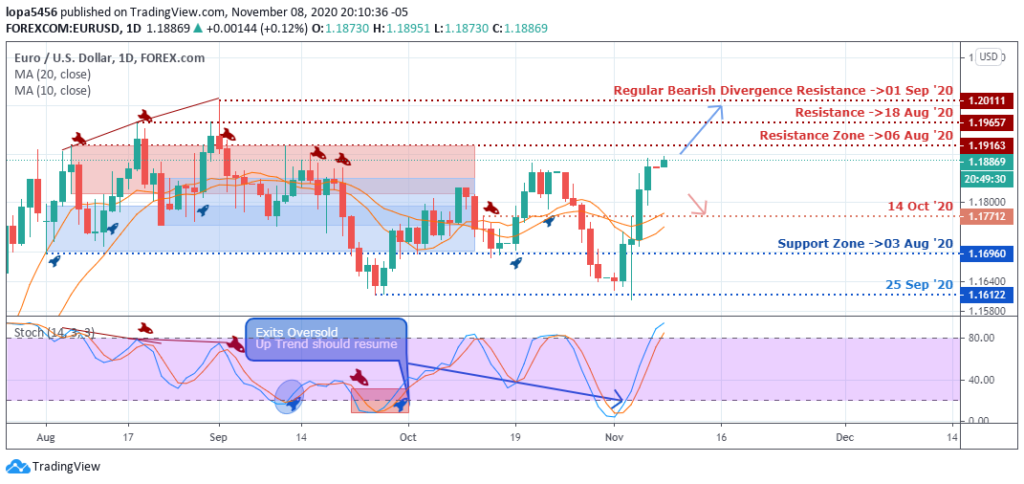
Daily Resistance: 1.20111, 1.19657, 1.19163
Daily Support: 1.1640, 1.16122
The daily candle shows a loss of momentum as the price is seen in an overbought zone for a possible short position in the coming days.
The bullish move may surge higher above the resistance levels it had struggled to cross above for the past days. A breakout will allow traders to place a long position on the EURUSD pair.
However, the recent lockdown taking place in the European zone due to the second wave of the COVID-19 may affect those regions’ economic activities, which will give room for short position opportunities for the traders from the 1.19163 levels down to 1.80000 zones.
H4 Chart

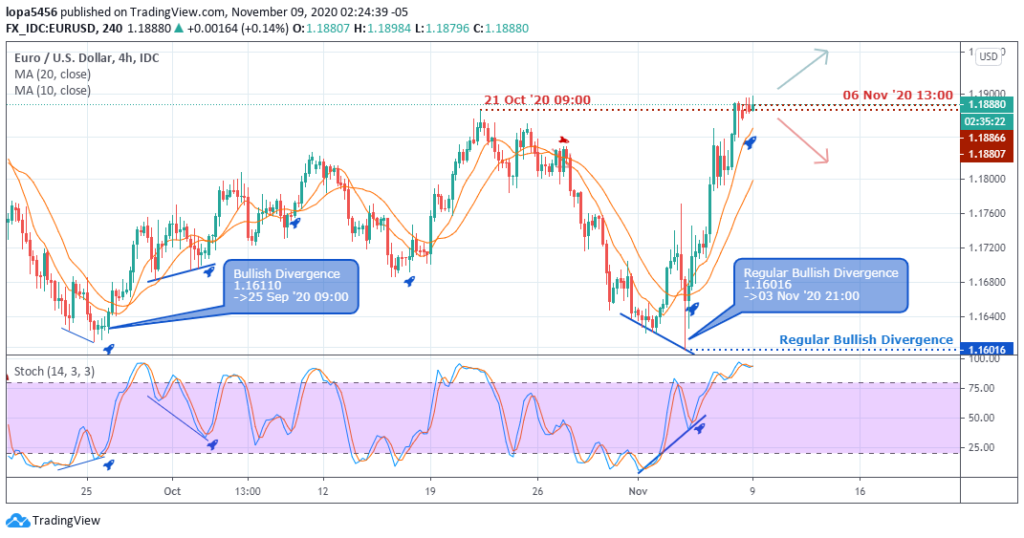
H4 Resistance: 1.20114, 1.18829, 1.19000
H4 Support: 1.17530, 1.17820, 1.16016
The four-hour chart shows price is entering the overbought zone from the stochastic indicator. The price is around the resistance zone, where the sellers placed short orders that took the price down to the support of 1.16016 before the bullish rise with a regular divergence confirmation of 03 November 2020.
If the resistance levels are to hold, we shall see a rejection of price from the zone for another bearish swing for a reversal.
However, if the bulls run are with momentum, we shall see a forceful breakout candle that will go through the resistance level (1.19000) to continue the forex platform’s bullish trend.
Bullish Scenario:
A possible general bullish scenario based on the weekly time frame is still likely if the bullish momentum can be sustained with a close above the high of 1.20114 on the weekly chart.
Bearish Scenario:
A general bearish scenario based on the daily time frame may occur if the resistance levels can reject the bulls’ advancement from the new week’s zones of 1.19657.
Conclusion and Weekly Price Objectives
The new COVID-19 second wave is another issue to worry about for the investors and more prominent institutions. They want a safe-haven for their investment, having experience losses during the first global lockdown.
The breaking news of the pharmaceutical company, Pfizer finding an above 90% efficient cure to the COVID-19 gave the USD a strong boost against the Euro at mid-week. We may see short sellers of the pairs taking profits at some point.

No Comments found