Bitcoin to USD ( BTCUSD ) Weekly Outlook , July 4 2019
BTCUSD Forecast and Technical Analysis & Fundamentals for Bitcoin
Introduction
As we enter the first week of the month of July, the Bitcoin price dips lower on major India forex brokers, sending panic across intraday trading forums. However, the technical and positive news in the space reveals the presence of the Bulls.
BTCUSD Technical
BTC/USD: Daily Chart

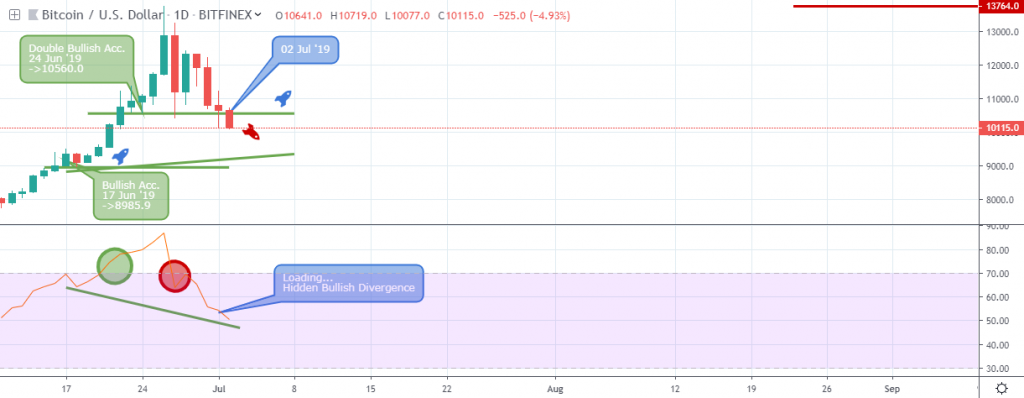
The pair maintained a steady uptrend from June 17 ’19, setting support at 8985.9 USD, and advanced further into overbought territory on June 21 ’19, as well as setting critical bullish support at 10560.0 USD on Jun 24 ’19.
Overbought areas are great for initializing trailing stop orders, to lock in potential profits. We believe a triggering of these stop orders from huge speculators (Whales) forced the price to tank by approximately 29%.
The earlier mentioned critical support level at 10560.0 USD prevented the price from a further decline and eventually prop the price in combination with a signaled hidden bullish divergence.
BTCUSD: 4Hour Chart

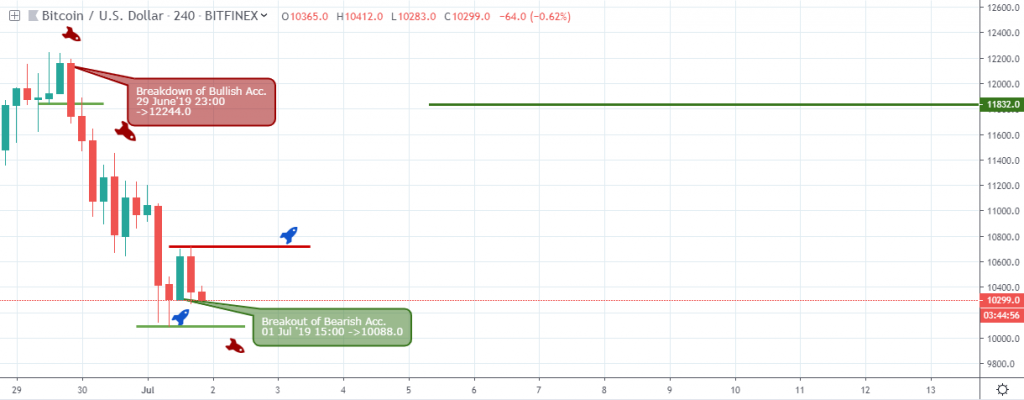
A closer view from the 4hour time frame reveals a buildup of the price decline, which started from a collapse of buying support on June 29 ’19 23:00 for about 16.6%.
The bears signaled a bear trap by closing below the July 01 ’19 15:00 support (10088.0 USD), and left sellers holding the bag after a bullish closing bar on Jul 02 ’19 03:00.
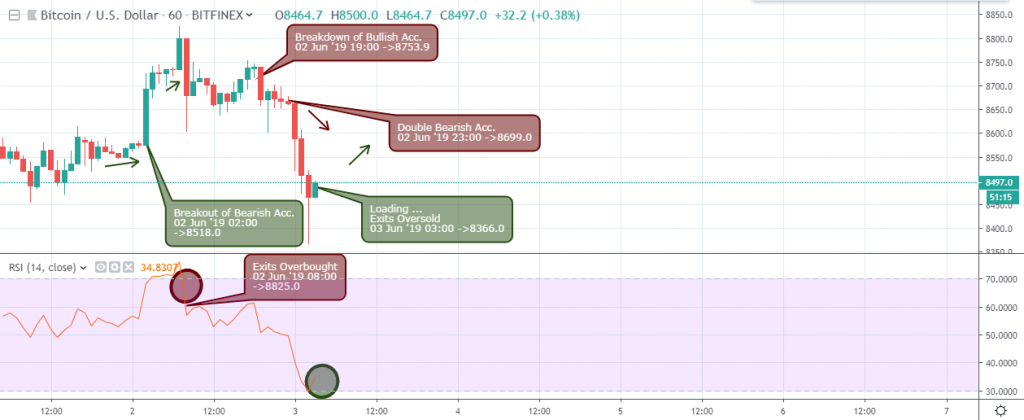
We move lower to the 1hour chart for a clear view of the technical price dynamics on July 01 ’19 23:00.
BTCUSD: 1Hour Chart

After the bearish trend, the pair signaled two regular bullish divergence patterns on July 02 ’19 03:00 and 09:00, setting support at 9780.0 USD and 9728.2 USD respectively. The patterns were signaled in combination with a break of selling resistance level at 9944.80 USD and 10176.0 USD respectively.
At press time, the Bitcoin price on our hand-vetted Bitcoin broker platforms has increased by about 17.5%.
Bitcoin Fundamentals
CCAF Cambridge Center for Alternative Finance: Provides Electricity consumption Data of Bitcoin for Regulators, Policy Makers, and Researchers
In the news released on 02 July by the CCAF, the total electricity consumed by the Bitcoin BTC Network is captured and tracked by a live index.
Dubbed the (CBECI) Cambridge Bitcoin Electricity Consumption Index, and updating every thirty seconds, it estimates the total annual energy consumed by the BTC network.
According to recent findings, the power consumption of the BTC network in a year equals that required to heat tea kettles for eleven years in the UK.
Comparing Bitcoins as a nation to other nations for electricity consumption, Bitcoin is ranked forty-third, ahead of countries like Singapore, Denmark Uzbekistan, and Romania.
I am not selling Bitcoin BTC at 14K USD: Mike Novogratz.
Novogratz a Bitcoin BTC enthusiast and founder of Galaxy Digital, in a 03 July interview with Bloomberg says that following his previous views about Bitcoin BTC ranging between the 10K USD and 14K USD bound, he won’t be selling his Bitcoin as the price will then be closer to the 20K USD round number resistance of 01 December ’17.
Conclusion and Projection
On major Bitcoin broker platforms, the hidden bullish divergence pattern on the daily chart confirms the resilience of the Bulls to restore the price of the number one cryptocurrency, which contributes a higher percentage to the total crypto market cap.
We look forward to the 17K USD resistance as a significant profit target; however, paying attention to the rejection of bullish support on the way up.

No Comments found