BTC/USD Forecast – Weekly Outlook, May 23 2018
Weekly Forex Forecast for Cryptocurrencies
Introduction
From a fundamental point of view, we also looked at speculative demand which we considered to be very low compared to previous years as well as in a range. This week, however, we’ll be comparing the speculative demand with other metrics.
Fundamentals
A major use case in cryptocurrencies is the launching of Initial Coin Offerings (ICOs). This new method of crowdfunding came with a lot of scams as well as legitimate startups. Never the less, it was a major fuel to bitcoin price, as well as other cryptocurrencies, Bitcoin being a gateway to most altcoins. This lead to the ban of ICOs in South Korea sometime around 2017. In recent times, South Korean lawmakers are making legislative moves to lift the bans on ICOs. If this is successful, it will increase adoption rate of blockchain technologies/startups, consequently increasing speculative demand.
Also in the news is a company in South Korea which disguises itself as a semiconductor factory taking advantage of low electricity in the Gyeong-ki province for mining cryptocurrencies. This illegal cryptocurrency mining was not only localized in South Korea but also high in Plattsburg a small town in New York. Residents started noticing the excessive usage of electricity by local miners.
In 2017, Jamie Dimon of JP Morgan said bitcoin is a fraud, only for the company to announce trading of Bitcoin Futures. In our opinion, Jamie Dimon created fear uncertainty and doubt in the bitcoin ecosystem in order for bitcoin holders to dump the currency and they buy it back.
Generally speaking, whether positive or negative criticism, as long as there is some form of publicity, the adoption rate of Bitcoin should stabilize into the next quarter.
Transaction Rate
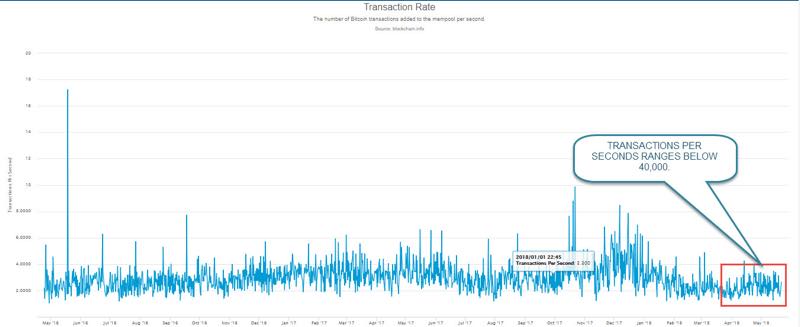
From the chart below, it’s obvious that transaction rates have dropped and are currently ranging below 4,000 transactions per seconds. Compared to December and January of 2017, transaction rate is slightly stable with little outliers. This generally indicates stability in bitcoin adoption.

USD EXCHANGE TRADE VOLUME
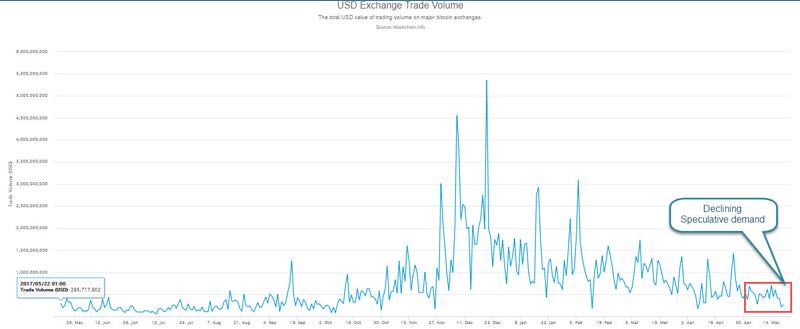
As volume in United States dollar exchange trade plummets, it signals low speculative adoption which could be responsible for the low bitcoin price. However, we should be expecting an explosion in volume, as this is similar to a Bollinger squeeze.

Technical Analysis
BTCUSD: Daily Chart

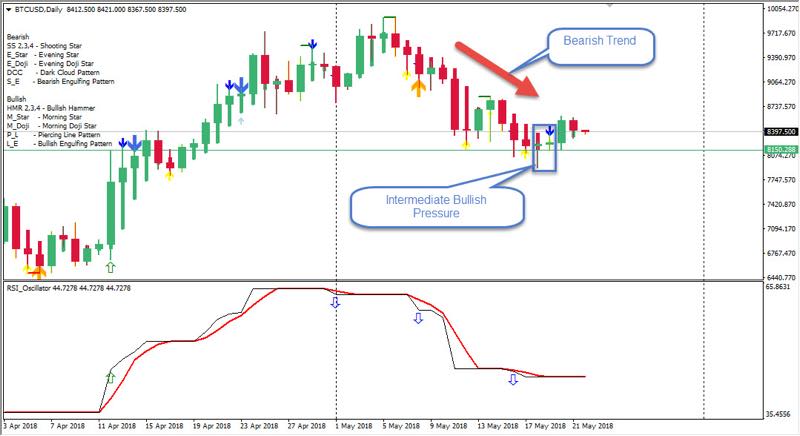
Above is the bearish trend we referenced last week, which contained the Chuvashov’s fork, along with the bearish regular divergence from a daily chart perspective. The new low formed at $7917.00 is followed by the formation of buying pressure, establishing a support level at $8150.28. Price closing below $8150.288 is an indication that price will establish a new low.
BTCUSD: 4-HOUR CHART

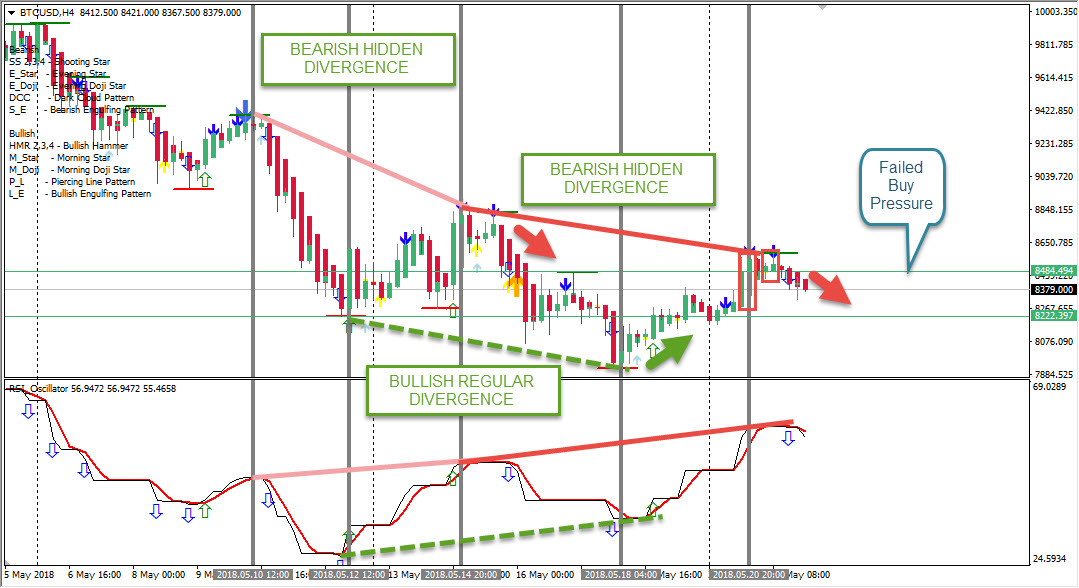
From a technical analysis point of view, the 4-hour chart offers a clearer view of the bitcoin price in US dollar. The pair has been in a consistent bearish oscillatory motion, signalling both bearish and bullish divergence patterns as shown above. Bullish divergence was triggered by a golden crossover of our custom Relative Strength Index (RSI) oscillator on 2018-05-18.
Most recently this week is another bearish hidden divergence, similar to the one formed on 2018-05-15. This recent bearish hidden divergence was triggered on2018-05-21 this week after a bullish pressure near the week’s open.
Conclusion
From a general overview, Bitcoin price in U.S dollar should continue south based on our above analysis. However, if the $8590.00 price level gets violated, it will be a surprise and hence higher highs.
Top 3 Brokers to trade BTC/USD


No Comments found