Bitcoin to USD Forecast & Weekly Analysis, June 21 2018
Weekly Crypto Forecast & Analysis for BTC/USD
Introduction
This year shows the overvalued nature of the cryptocurrency markets in the year 2017. The huge decline we are experiencing this year clearly indicates the market now seeks a point of equilibrium between demand and supply. A lot of enthusiasts, especially HODLers (Hold on to dear life), hope that the decline is a mere correction, well I bid to differ on that, and I believe that a new low may be lurking in the background, which should bring about long-term stability in the market and industry adoption of cryptocurrencies at large.
Fundamentals
Speculative Adoption
There have been recent price manipulation conspiracy theories circulating in the cryptocurrency community claiming “whale Manipulation”. In my opinion, this is just pure speculative demand and supply. Well, during the bull run of 2017, everyone wanted a piece of the action, and there were not enough big players willing to bet against the rising price of the Bitcoin. December 17th, 2017, the first trading day of the CME, allowed for large institutional traders to short-sell the BTC vs. U.S. dollar. This, followed by negative media reports on security and regulation further caused the price to plummet from its all-time high.
Regulatory and Security Adoption
A lot of traders and investors are beginning to develop scepticism towards Bitcoin adoption as regulators clamp down on ICOs and exchanges. So at the moment, we can say that investors are risk-averse, moving their holdings from highly volatile asset classes to more stable ones.
There is a rapid decline in the adoption rate of the cryptocurrency, as well as declining user growth. Profit-taking, hedging, and possible sell stop orders in anticipation of further lows are what is common in the space.
As a lot of enthusiasts, especially HODLers, hope that the decline is a mere correction, well I bid to differ that a new low is lurking in the background, hopefully price stability, and consequently a true reflection of the market’s value.
Technical Analysis

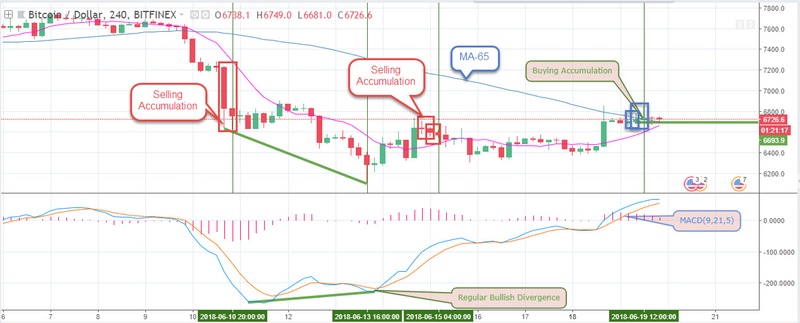
To get a better perspective on the weekly dynamics of the exchange rate of Bitcoin to USD, we turn to the 4-hourly chart shown above. The bullish regular divergence formed last week 13th of June, lead to the rather rising but low volatility in price. This was later followed by selling pressure on the 15th, and later buying pressure on the 19th, with support at $6693.00. Although this gives optimism to bitcoin brokers who may want to buy bitcoin at this price.
I would say that the volatility and recent negative fundamental biases do not give the confidence to buy for a long term. This buying pressure may, however, offer scalping opportunities.
Bitcoin to USD: Daily CHART

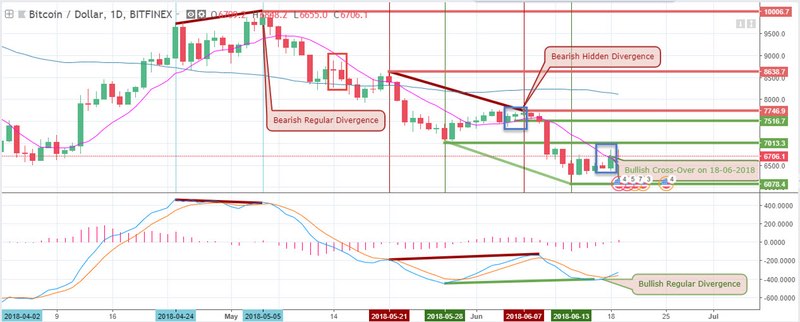
Following the regular bearish divergence on 05-05-2018, is a hidden bearish divergence on 07-06-2018. Coincidentally, the daily chart also formed a bullish regular divergence on the same 13th of April, triggering buying opportunities at same price zone as the 4-hourly chart. This has the potential of sending the price up towards the $7516.70 previously failed support level, which may serve as a possible resistance.
BTCUSD: Weekly CHART

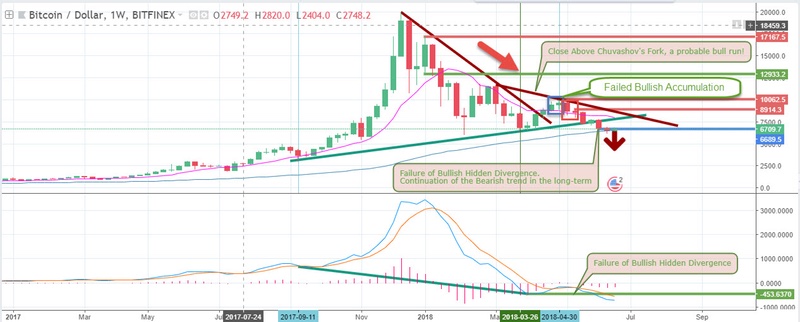
For a longer-term overview of the BTCUSD pair, we zoom out to the weekly chart which first triggered a bullish hidden divergence on the March 26th of this year. The pair later established a Chuvashov’s fork formation, which presented optimism to resume the bullish trend, but unfortunately, price recently closed below the bullish hidden divergence trend line. This consequently signals a long-term sell position and new lows to be established in 2018.
Conclusion and Projection
My projection this week is that the pair will trend lower on the long-term trading between the $2980.40 and $5400.2 price zone. This zone I believe will be long-term take profit zones for most bitcoin brokers.
Top 3 Brokers to trade Bitcoin to USD


No Comments found