Bitcoin to USD ( BTCUSD ) Weekly Outlook , November 14 2019
BTCUSD Forecast and Technical Analysis & Fundamentals for Bitcoin
Introduction
A bizarre rumor has been spreading this week after privacy based coin Grin on November 11 received an anonymous donation of about 50 Bitcoin (BTC), with many people claiming that Satoshi was behind the generous donation.
The company, who, on November 11, announced the donation on Twitter, also revealed that the payment was made via crypto broker Coinbase by a generous giver who expressly desired to remain anonymous.
According to Grin developer Daniel Lehnberg, the donor who remained undisclosed donated to support the technology and the protocol.
Let’s analyze the charts of the BTCUSD, and identify technical drivers of the number one cryptocurrency following a top-down approach.
BTCUSD Technical Analysis
Weekly Chart

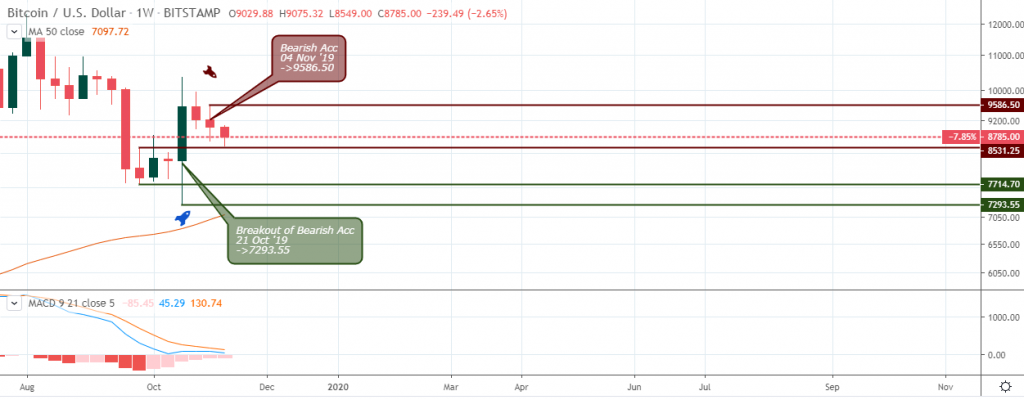
Resistance: $9586.50, $10955.48, $10350.00, $10380.07
Support: $8531.25, $7293.55, $7714.70
Bitcoin bulls were optimistic for an immediate continuation of the October 25 price surge, only for the price chart to show bearish sentiment on the weekly time frame.
The bearish signal after last week’s closing price sets resistance at $9586.50 and further threatens a series of bearish closing weekly bars. However, if the $8531.25 support holds its ground, we may see a recoil of the Bitcoin price back to the upside.
Daily Chart

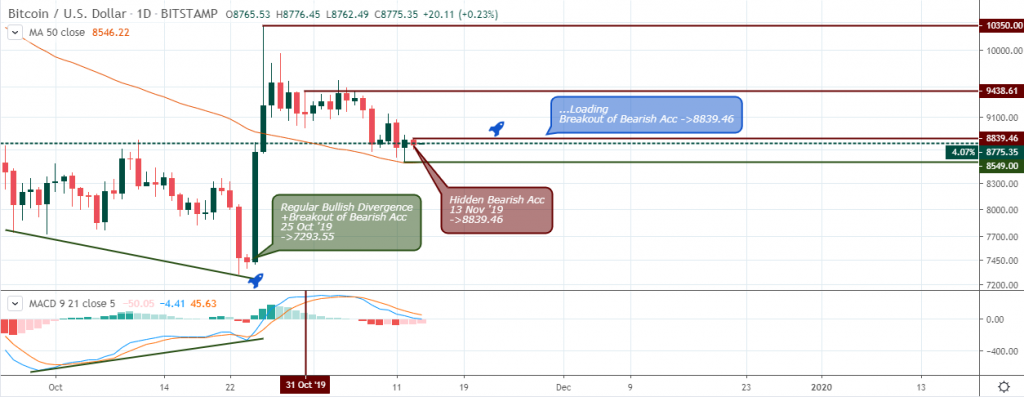
Resistance: $8839.46, $10350.00, $9438.61, $9819.92
Support: $8549.00, $7293.55, $8546.03
A view from the daily time frame shows a combination of a breakout of resistance and regular bullish divergence on October 25 ’19.
A not too distance collapse of support on November 08 highlights similar bearish sentiment like the one on the weekly time frame, as the BTCUSD rests on the MA-50.
With a hidden bearish resistance set up on November 13, a price close above the threshold may confirm an upward surge in price for the long haul.
4Hour Chart

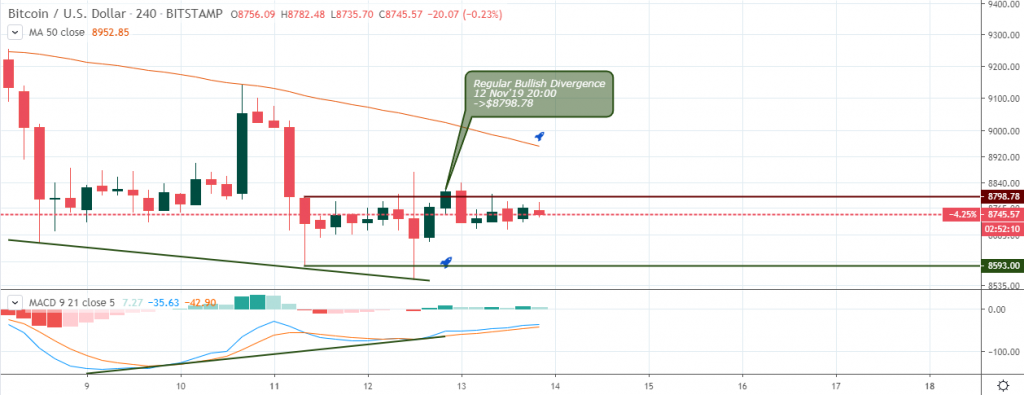
Resistance: $9257.18, $9142.33, $8872.47
Support: $78593.00, $8549.00, $8661.00
Let’s move one step lower to the 4hour time frame. Notice how the MA-50 resisted the further price increase at the closing bell on November 10 16:00, this was after the bulls broke above $8819.13 resistance.
The pair set up a new low and signaled a regular bullish divergence pattern on November 12, 20:00 after a golden cross of the MACD, and another close above $8798.78.
1Hour Chart

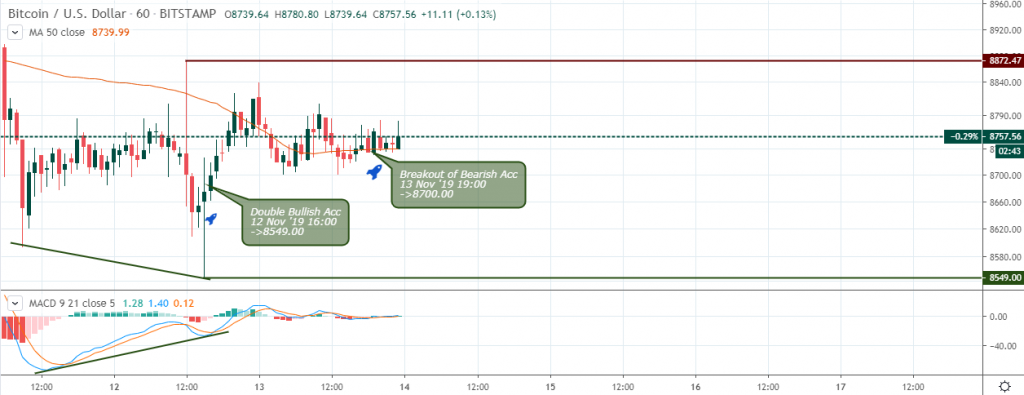
Resistance: $8872.47, $9142.33
Support: $8549.00, $8593.00
From the intraday 1hour time frame, the BTCUSD on all Bitcoin broker sites signaled another regular bullish divergence, a sign that the bears are losing their grip on the price.
The Bitcoin price again forms a higher low at $8700.00, on November 12, 19:00 stressing a buildup of bullish momentum.
Bitcoin Fundamentals
Swiss crypto broker strikes a deal that will see 65,000 Swiss Retailers accept Bitcoin
European payment and transaction services provider Worldline has struck a partnership with Swiss cryptocurrency broker Bitcoin Suisse that will promote acceptance of crypto payment in the country.
As per reports on November 11, the two firms have agreed on a partnership to provide crypto payment services to Swiss merchants and consumers in stores and online.
The 65,000 Swiss merchants who are currently using Wordline’s nationwide payments infrastructure, will be able to use the new service which will now be augmented with cryptocurrency payment abilities. With this, the service will evolve to support the use of the new asset class in e-commerce and at a bulk range across physical points of sale.
Conclusion and Projection
The intense selling pressure on the weekly time frame shows that the Bitcoin price could plunge lower towards the $7714.70 support. However, if the MA-50 support on the daily time frame holds, we may see a resurgence of the bullish trend.

No Comments found