USD/INR – Weekly Outlook & Analysis for 31st December 2020
USDINR Forecast & Technical Analysis for Forex
Introduction
The USD seems to hold its own against the Indian Rupee as seen on online trading platforms despite a sharp plunge in the USD Index (DXY).
Let’s touch on interesting fundamental events as well as technical chart patterns driving the USDINR exchange rate.
India’s Fundamentals
This week’s important news for the Indian Rupee includes Trade balance, the M3 Money supply, current Account in USD, and Balance of Payments also in USD.
The results came out negative for Trade balance at -14.80B, which is lower than the previous at -10.00B, a first since its rise in September 2019 at -46.20B.
India’s M3 money supply recently started slowing after breaking out of a bottom on April 23, 2020, at a value of 10.2%.
The Money supply remained unchanged at a value of 12.4%, which is the same as the previous value.
US Fundamentals
Mitch McConnell, US Senate Majority leader, refutes deliberations of increasing COVID-19 relief funds to $2000.00.
The Greenback continues to slump since President Donald Trump signed the bill on coronavirus aid. Such a move implies less confidence in the USD as a reserve currency.
Analysts speculate on the US government releasing stimulus as the second wave of COVID-19 infection will deal further blows on the US economy.
More analyst speculations point at the US Feds keeping interest rates low for a more prolonged time, along with more measures towards economic support by President-elect Joe Biden.
According to a Reuters report, we should expect further lockdown in England. At the same time, US President-elect Joe Biden speculates that Americans may be looking at years before they can get vaccinated at the current COVID-19 rate.
USDINR Technical Analysis
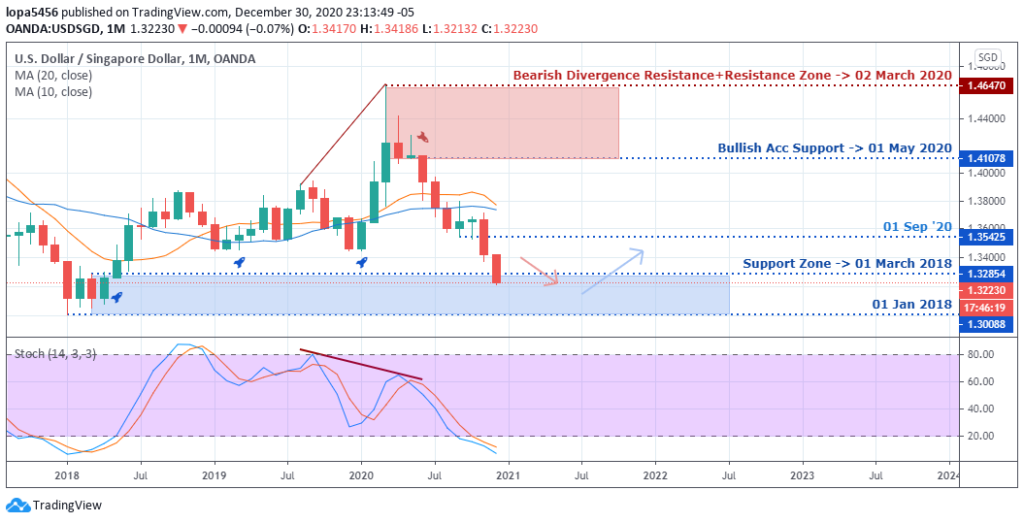
Monthly Chart Projection: Bullish Correcting

Monthly Resistance Levels: 77.416, 74.653
Monthly Support Levels: 72.658, 68.123
The USDINR monthly bullish trend started after the RSI entered the overbought area on April 02. ’18.
Coming to a close of the month and year 2020, the bearish divergence fails to force the USDINR exchange rate below the MA20, an indication that we may be seeing a bottoming of the correction phase and a continuation of the uptrend.
If the price fails to advance into the oversold area and cross the level-50, we should get a confirmation to scale into a bullish trend.
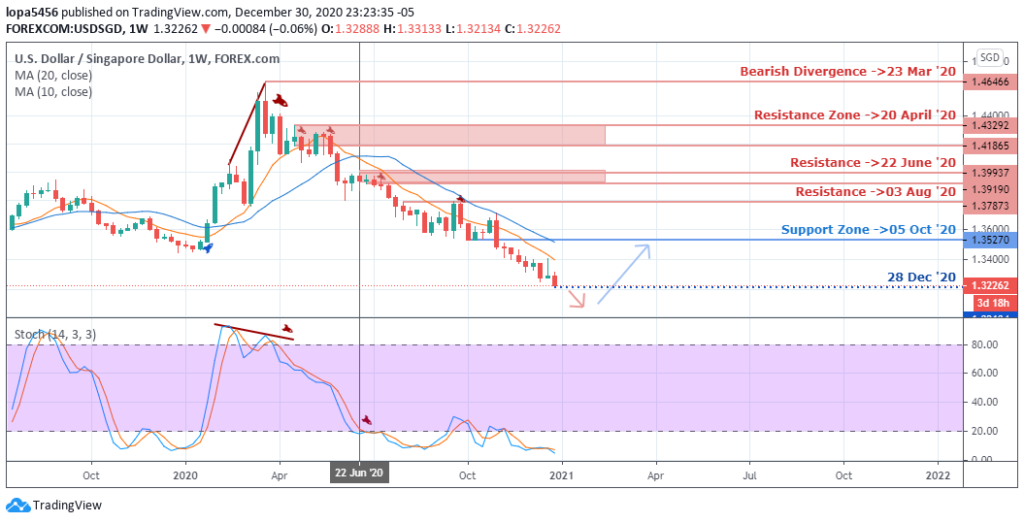
Weekly Chart

Weekly Resistance Levels: 77.401, 75.478, 74.459, 74.137
Weekly Support Levels: 72.066, 72.658, 70.194
A view from the weekly-TF shows a golden cross of the MA10 and MA20. However, the bearish-Acc resistance 74.137 shows that the pair may trade lower in the last days of the year and maybe even into the early parts of 2021.
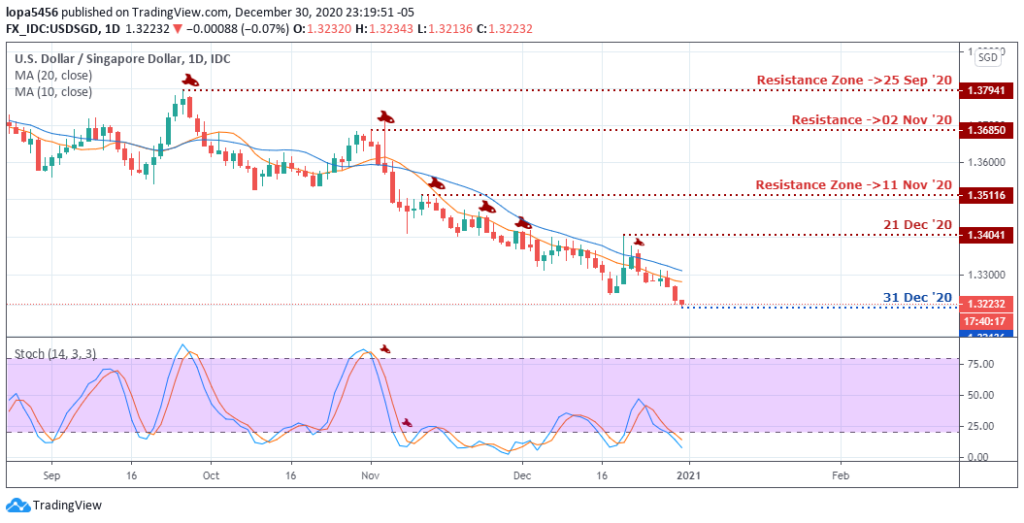
Daily Projections: Bearish-consolidating

Daily Resistance Levels: 75.087, 74.216, 73.802
Daily Support Levels: 73.071, 72.870
After a breakdown of the 74.216 support set on November 03 ’20, the USDINR price sprung back into a double top formation and finally declined into a bearish trend.
A dead cross of the MA10 and MA20 confirmed the bearish trend, and a recent collapse of the bullish support now turned resistance (73.802) increased demand for the Indian Rupee.
Bullish Scenario:
An upward trend continuation should resume after a bearish closing in December 2020. However, a golden cross of the MA10 and MA20 on the daily-TF should reinforce confidence to take a long position.
Bearish Scenario:
The bearish direction stays intact as long as the stochastic %K and %D remains in the oversold area. However, an exit of the oversold zone should hint at a slowing of bearish momentum.
Conclusion and Projection
We believe that the Greenback should strengthen against the Indian Rupee in Q1 2021 from a long term perspective. A confirmation from the lower time frame should give the confidence to take scale into the anticipated uptrend on any suggested online brokers on our web site.

No Comments found