BTC/USD Weekly Outlook and Bitcoin Fundamentals , May 21 2020
BTC/USD Forecast and Technical Analysis & Fundamentals for Bitcoin
Introduction
The Covid-19 pandemic has changed the entire system of the world in the way it transacts its businesses.
We can see that from various fundamental news across the globe, policies from different countries show that governments agreed to add another stimulus to the previous stimulus package. These steps were acts of commitment to stop any impending recession.
The BTC/USD on major BTC broker platforms, such as IQ Option, is getting ready to shoot for 2017 all-time high considering an increase in institutional adoption.
BTC/USD Technical Analysis
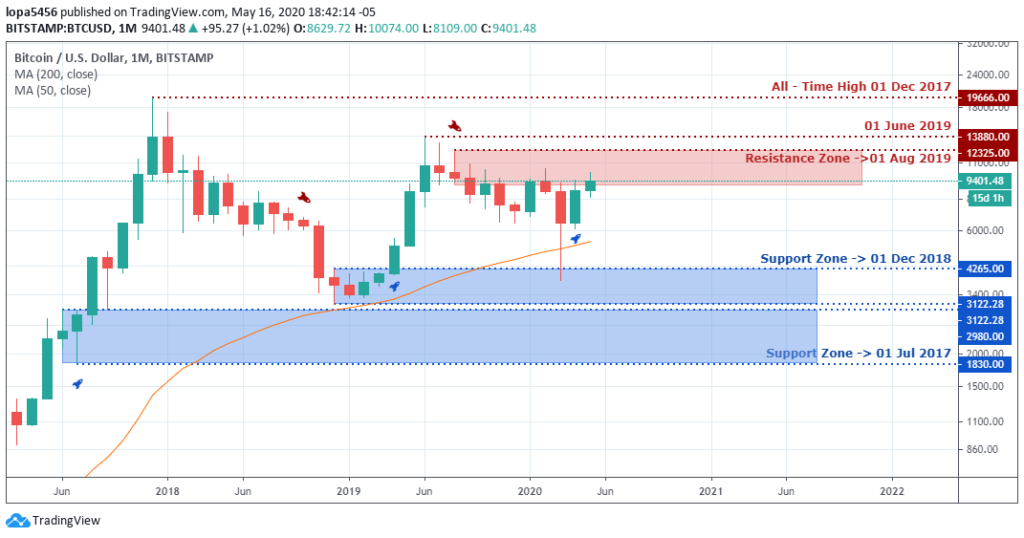
Monthly Chart

Monthly Resistance Levels: 19666.00, 13880.00, 12325.00
Monthly Support Levels: 1830.00, 3122.78, 4265.00
It has sustained the bullish run for the past two months since the pandemic of Covid-19 began after a strong rejection of the bearish move at the support zone of 4256.00.
The BTCUSD is at a resistance zone of 12235.00; if the bulls’ momentum is strong we can see the area taking off. But if it fails, we can see another push to the downside.
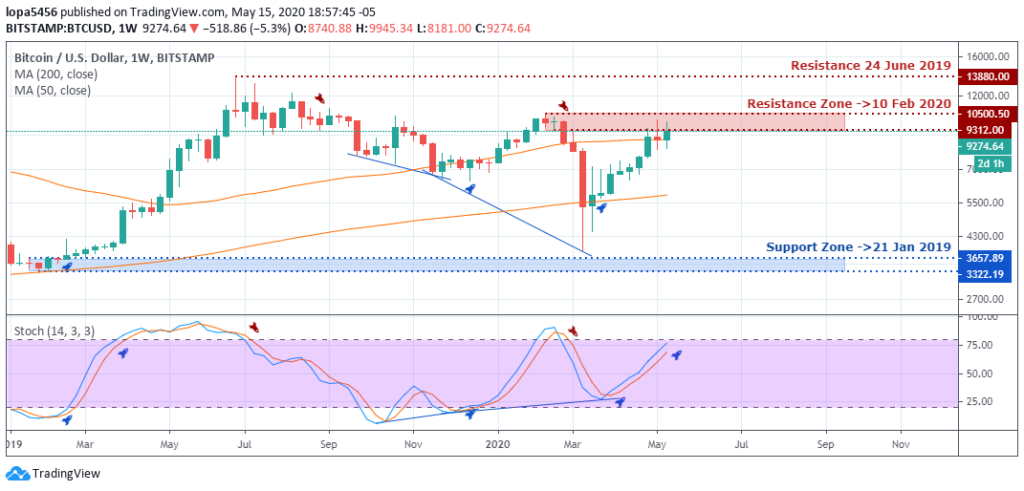
Weekly Chart

Weekly Resistance Levels: 13880.00, 10500.50, 9312.00
Weekly Support Levels: 3657.89, 3322.19
The bearish trend ended after the bullish regular divergence was seen on the stochastic oscillator, and the price of BTC/USD rose from the support zone of 3657.89 to 10500.50.
The resistance zone is a psychological area for BTCUSD, and brokers are waiting for the price to react at the zone either to close above it or to reject it.
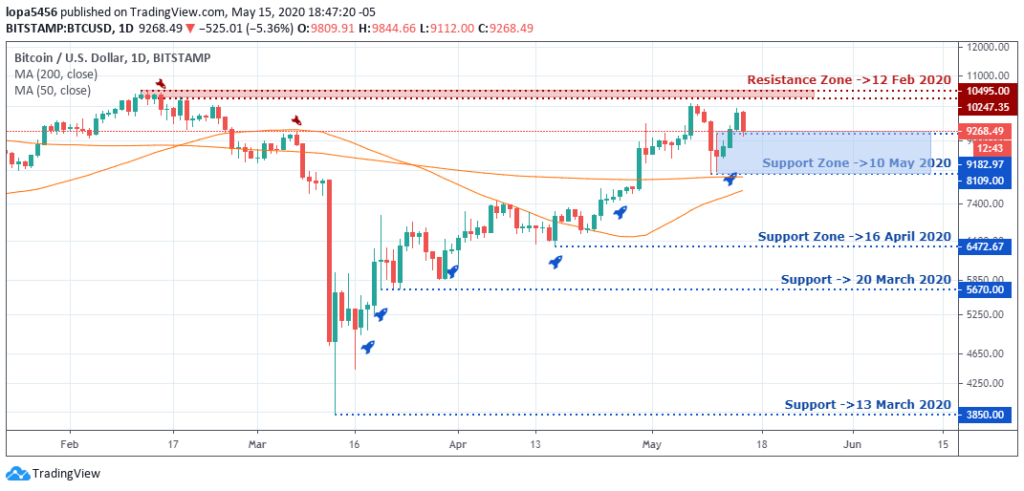
Daily Chart

Daily Resistance Levels: 10495.00, 10247.35
Daily Support Levels: 3850.00, 5670.00, 6472.67, 81109.00, 9182.97
The upsurge of the uptrend has been for days with rising supports. The recent support of May 10, 2020, is pushing the price of bitcoin back for a retest to the present resistance zone of 10995.00 that rejected the price.
However, the resistance zone is a critical area for brokers and investors, should the price close above it, it will attract more buyers, but if the region rejects price and it closes below 9182.97 zone.
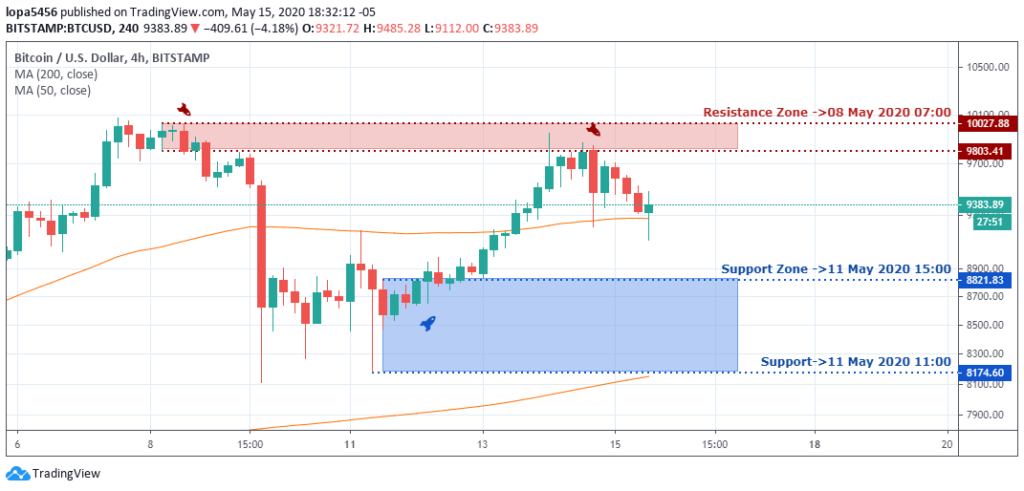
H4 Chart

H4 Resistance Levels: 10027.38, 98031.41
H4 Support Levels: 8174.60, 8821.83
The bitcoin has been moving between the support and resistance zone of 8174.60 and 10027.38, respectively. The movement of bitcoin is oscillating between these two zones, telling us that bitcoin is in a range.
Bullish Scenario:
The current swing of bitcoin is to the upside of the market. However, the price must close above the resistance to attract more investors.
Bearish Scenario:
The bearish scenario can come to play should the bears close the price of bitcoin below the current support zone and this will expose the next support of 6472.72.
Bitcoin BTC News Events
Since the pandemic of Covid-19 affected many businesses and economies of countries, they have introduced different stimulus packages to help stimulate the economy.
Apart from the previous stimulus package of $2 trillion, the house of Democrats sent in another proposal of $3 trillion to stimulate the American system, easing unemployment and boosting consumer spending and other sectors.
With all these policies in place, the government has also reduced interest rates to help her people avoid another recession.
Since the USA bailout helps public companies and prevent lost in investment, it will also weaken their purchasing power since most of the American citizens don’t own assets.
As the world economy continues to get better, bitcoin as an asset class will attract investors again.
BTC/USD Conclusion and Projection
The Covid-19 crises have affected the asset classes also, and it dropped in value. The bullish sentiment will continue in the market if the price of BTC/USD can close above the psychological zone 10500.00.
The recent printing of money by the US government of $3 trillion will also affect other assets giving strength to the dollar.

No Comments found