USDINR – Weekly Outlook & Analysis for May 15 2019
USDINR Forecast & Technical Analysis for India Traders
Introduction
The impact of the coronavirus pandemic is evident in every sector of the economy. Businesses have been grounded for individuals, small enterprises, and multinationals across the globe.
The India forex is still uncertain about the recovery rate of the economy. Most Binomo investors and institutions are watching the reaction of the various packages to boost the economy.
Let us analyze the various economies for better information centred around the currency pairs.
India’s Fundamentals
There had been changes in the various sectors of the Indian economy like the consumer industry, automotive, travelling, and hospitality services, which also affects the behavioural pattern of spending because of the pandemic situation.
However, the Indian government has announced an aid package of 1.7 Trillion of Indian rupees to stimulate the economy. It was also estimated that GVA lost over 9% since the coronavirus pandemic.
U.S. Fundamentals
The Consumer Price Index (CPI)
The CPI data is a useful tool for measuring the average change in the price of goods and services that consumers paid for, such as automotive fuel and food items. From statistical data, CPI rose from March 2019 to March 2020 by 1.5%, while energy prices were down by 5.7%.
The impact of this current pandemic (coronavirus) will affect the upcoming CPI data. The previous data was -0.4% as a result of an average change in energy, airline fare, and indexes for all items fell.
The forecast expected is -0.7%; if the Actual is greater than the forecast, it is good for the economy, but if it less than forecast it is bad for the currency.
USDINR Technical Analysis
USDSGD Long-term Overview: Bullish Slowing
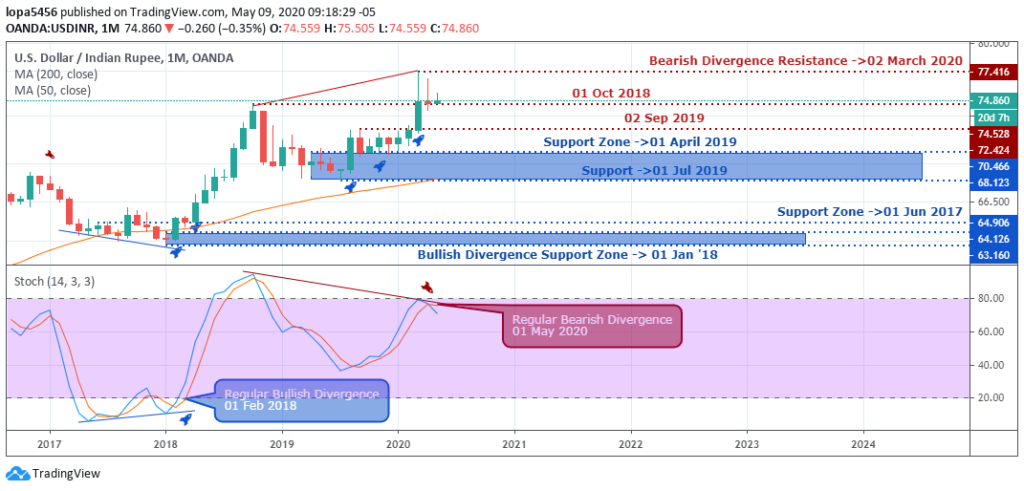
Monthly Chart

Monthly Resistance Levels: 77.416, 74.528, 72.322
Monthly Support Levels: 63.160, 68.123
The USDINR has sustained its uptrend since the bullish divergence of 01 Feb 2018, at (63.160) with a bullish engulfed candle. The most recent bullish trend from the support of 68.123 is slowing down because the previous month shows a general price weakness for USDINR across all online broker platforms.
Since the rejection of the price at 77.416 on 02 Mar 2020, we can spot a bearish divergence from the resistance zone and our indicator. From the interpretation, we may see USDINR has its correction soon.
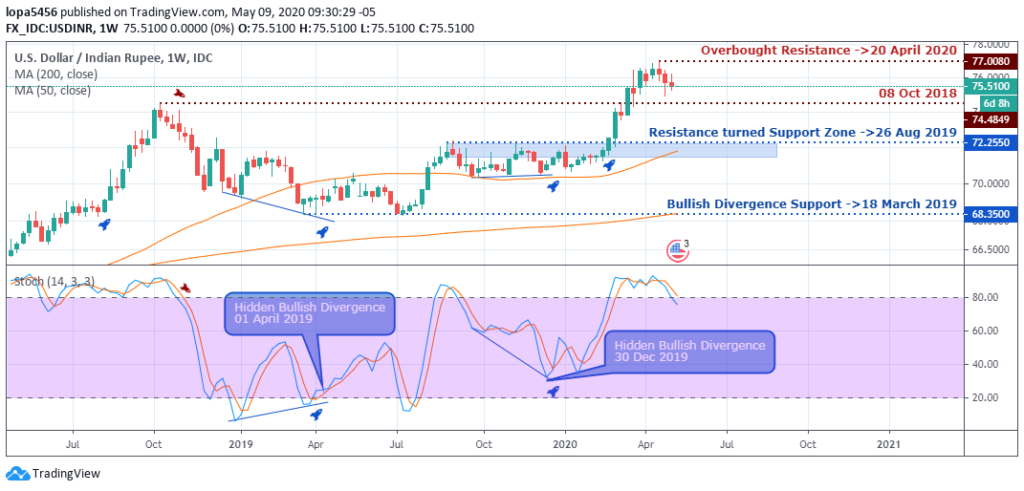
Weekly Chart

Weekly Resistance Levels: 77.416, 72.424
Weekly Support Levels: 68.123, 70.320, 74.214
From the above resistance level of (77.416), we can see that the sellers have been in control of the market for three weeks, and the price of USDINR is in an overbought zone, and this condition will attract more sellers.
The current support level of 26 Aug 2019 is a psychological zone for brokers, retail traders, and other investors. If the price should close below the resistance turned support zone of (77.2550), we can say there is a reversal of the trend in the market.
USDINR Medium Term Projections: Bullish with High Volatility
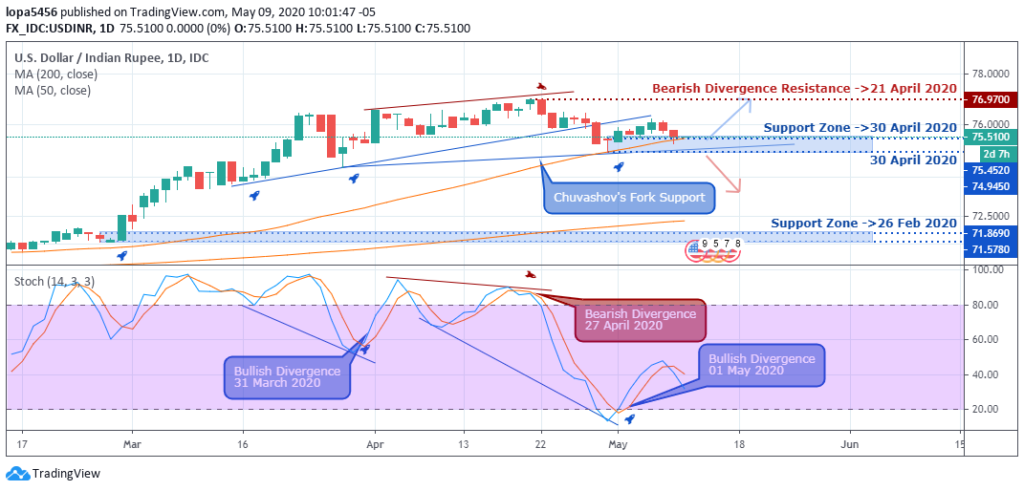
Daily TF

Daily Resistance Levels: 77.416, 76.28, 74.36, 71.886, 71.314
Daily Support Levels: 70.32, 70.346, 71.073, 71.472, 73.428, 74.214
We have been experiencing a downtrend for some days after the bearish divergence was spotted on 27 Apr 2020. At press time, the price sprang off the support zone, and it is retesting the zone.
Should the price closes lower than the level we have a continuation of the trend, but if it fails, we shall see the price going to test the resistance level of 77.416.
The bullish divergence spotted on 01 May 2020, could signal correction of the downtrend.
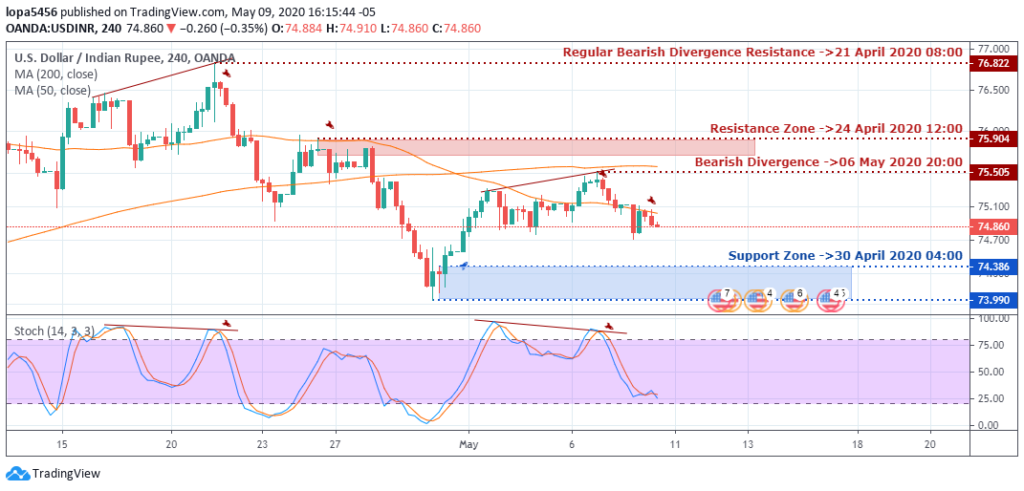
H4 Chart

4Hour Resistance Levels: 77.416, 75.502, 74.932, 74.522, 74.232
4Hour Support Levels: 73.990, 74.386, 74,700
The bearish movement of USDINR started from the bearish divergence on the 21 Apr 2020. We have seen bearish divergence from the indicator and price actions from the chart.
However, there was a rejection from the support zone of 73.990, which took the price up to the 75.505 resistance zone.
Bullish Scenario:
A general bullish scenario can be considered based on the 4-hour time frame should the price close above the resistance level of 77.905
Bearish Scenario:
A general bearish scenario has been in play since 21 Apr 2020, based on the H4 time frame. The bearish momentum is evident from the higher time frames, also showing a sign of strength for the Indian rupee and weakness for the US currency.
Conclusion and Projection
The pandemic event of coronavirus is becoming weakened as countries are recovering gradually from its effects on the economy. The bailout packages are going to help various industries and institutes recover fast.
As the new month unfolds, we shall see more signs of improvement all-round the globe. Investors, institutions, and retail traders are watching the Indian forex market to make a confident decision.

No Comments found