USDINR – Weekly Outlook & Analysis for April 30 2019
USDINR Forecast & Technical Analysis for India Traders
Introduction
In the last week of the first month in Q2 2020, the USDINR (IFT) and other India forex markets did experience a bullish run. The USD remains a haven for major players in the forex market.
Let us analyze the charts on various Time frames for a better understanding of the market.
India’s Fundamentals
Impact on Indian GDP
The effect of Covid-19 pandemic has weakened the strength of the Indian rupee (INR), and its impact on Indian’s GDP growth will be significantly felt. A low-interest rate policy will help to stimulate business activities from the central banks aimed at making credit available for business. Also, the finance minister announced a $23 billion stimulus package to cushion the disruption of the economy. Indian is in a lockdown situation like the rest of the world to contain the spread of the coronavirus
U.S. Fundamentals
US Advance GDP q/q
The US GDP report is released quarterly, and this is the first for the year, its’ impact in the market will come with high volatility. It’s a useful tool in measuring changes in inflation, adjustments in the value of all goods and services produced by the economic activity, and to gauge its health.
The upcoming data to be released on April 29 has the following; forecast (-3.9%), while the previous is (2.1%). Therefore, if the Actual data is above the estimate, it’s suitable for the currency, but if it is lower, it shows weakness in the currency.
USDINR Technical Analysis
USDINR Long term Projection: Bullish
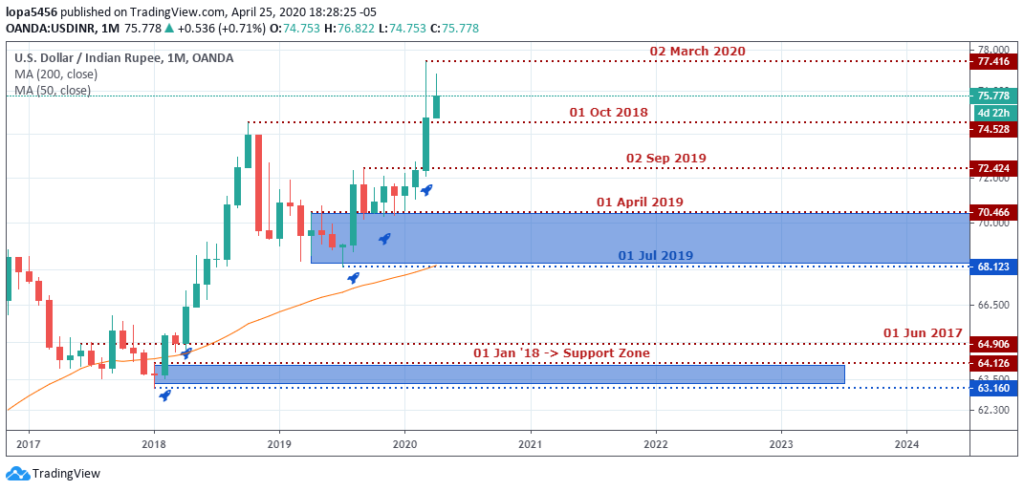
Monthly Chart

Monthly Resistance Levels: 77.416, 74.528, 72.322
Monthly Support Levels: 63.160, 68.123
You can see from the chart that the bullish momentum is still in play right from the current support zone of 68.123. The coronavirus pandemic has made the Indian Rupee weak against the US dollar due to instability in the market.
What are we expecting for the week? The India forex players, Investors, and retail traders across online broker terminals will be watching how the month’s candle will close. The resistance level of 77.416 is a zone all players are waiting.
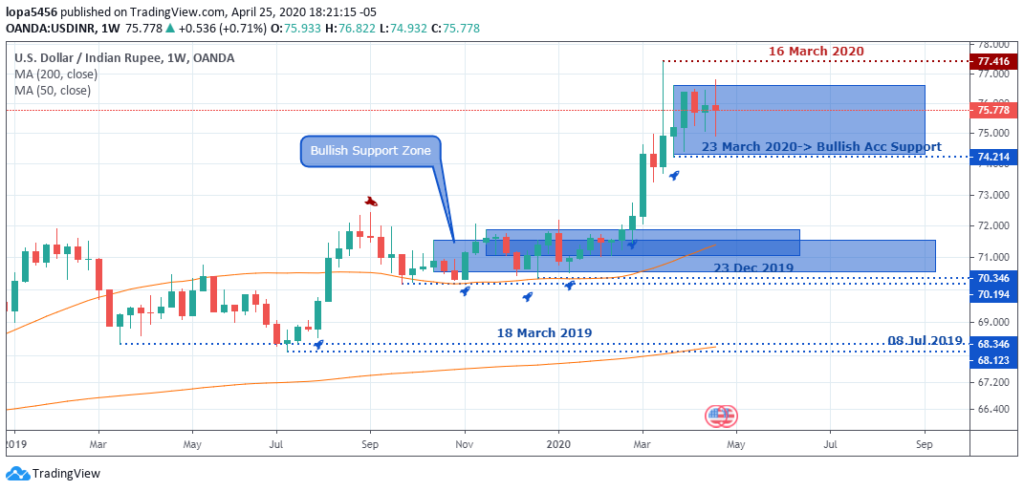
Weekly Chart

Weekly Resistance Levels: 77.416, 72.424
Weekly Support Levels: 68.123, 70.320, 74.214
For the past two weeks, the USDINR (IFT) price has ended as a Doji. This shows that there are uncertainties in the market.
The market is in a range between the resistance level of 77.416 and the support level of 74.214. However, a breakout to either side will indicate the next direction for the pair.
USDINR Medium Term Projections: Bullish with High Volatility
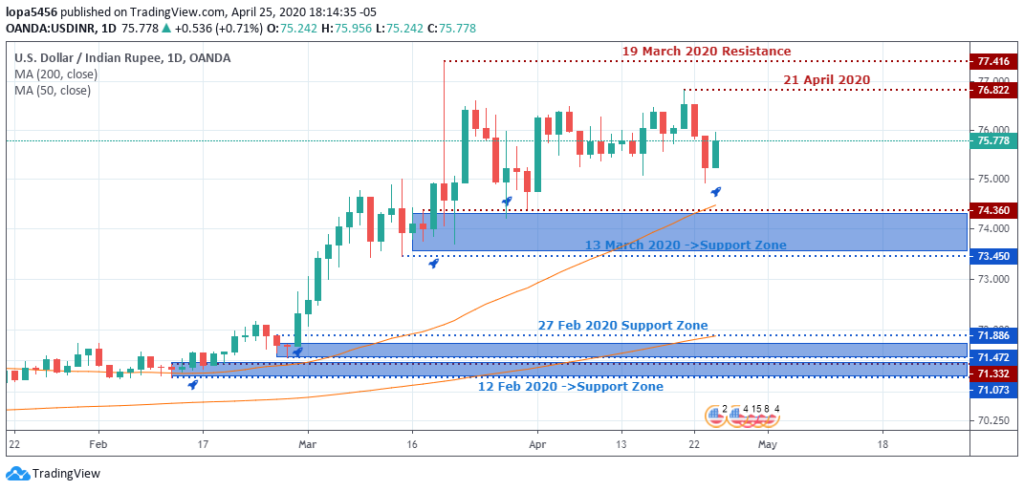
Daily Chart

Daily Resistance Levels: 77.416, 76.28, 74.36, 71.886, 71.314
Daily Support Levels: 70.32, 70.346, 71.073, 71.472, 73.428, 74.214
After a strong rejection of price on March 19, 2020, at 77.416, the market has been oscillating with no clear direction.
For safety trades, it will be advisable for traders to wait for a more precise pattern, reinforcing confidence to make a profitable trade.
4HR Chart
4Hour Resistance Levels: 77.416, 75.502, 74.932, 74.522, 74.232
4Hour Support Levels: 73.45, 73.694, 74.214, 74.411, 75.262, 75.368
Bullish Scenario:
The overall trend in USDINR (IFT) is an uptrend. The shift in momentum will be seen if the support 74.214 is taking out.
Bearish Scenario:
The pressure on the downside is gradually building up because the bullish momentum is struggling to close above the high price of 77.416. The bias to sell USDINR (IFT) will be more definite if PRICE can close below the support of 74.214.
Conclusion and Projection
Many countries are gaining some advancement against the coronavirus pandemic, recovery rates are coming up, and signs of relief are in the air. The lockdown policies are getting relaxed also, and projections are made for businesses in various parts of the world to revive industries through various central banks’ interest rate cuts.
As the week unfolds, we expect the market to define its direction, having been uncertain for the past weeks.

No Comments found