USD/INR – Weekly Outlook for December 20 2019
USD/INR Forecast & Technical Analysis
Introduction
The USDINR maintains a strong bearish outlook on XM platform after the bears forced the price below significant support level as a result of positive fundamentals for the Rupee.
Let’s take a closer look at these fundamental and technical events driving the exchange rates of the USD to INR.
India’s Fundamentals
India Wholesale Price Index (WPI) Inflation
The Wholesale Price Index (WPI) is an evaluation of any variations is the price of goods sold by wholesalers.
A higher number has a stronger effect on consumer inflation.
A bullish trend can be expected for the INR when the data released is higher than anticipated. If the data published is less than forecasted, then traders can expect a bearish trend for the currency.
Following the latest data published on December 16, traders can presume a bullish bias for the INR as the data tells the present reading to be 0.58%, previous reading to be 0.16%, and the forecast data to be 0.74%.
U.S. Building Permits
Building Permits evaluates any changes in the number of new building permits issued by the government. The index is a key indicator of demand in the housing market.
A bullish trend can be expected for the USD when the data released is higher than anticipated. If the data published is less than forecasted, then traders can expect a bearish trend for the currency.
Following the latest data published on December 17, traders can expect a bearish trend for the USD as the data shows the actual reading to be 1.482M, previous reading to be 1.46M, and the forecast data to be 1.410M.
USD/INR Technical Analysis
USDINR Long term Projection: Bullish Swing
Monthly Chart

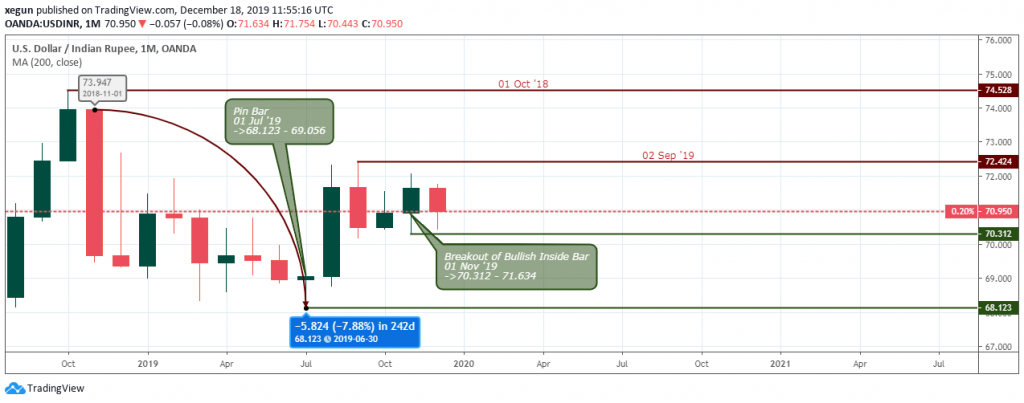
After a price collapse of about (-7.88%) from the Nov 11 ’18 open at 73.947, the USDINR signaled a pin-bar candlestick set up on July 01 ’19 setting sound support at 68.123, and consequently eroding the gains of the Indian Rupee.
Later, on Nov 01 ’19, the USD to INR rates closed above a bullish inside-bar resistance, and ready to skyrocket above the Sept 02 ’19 mother-bar at 72.424.
The July 01 ’19 support level will be a good reference point below, in which you can establish your stop loss level to target the 74.528 resistance level of Oct ‘18.
Weekly Chart

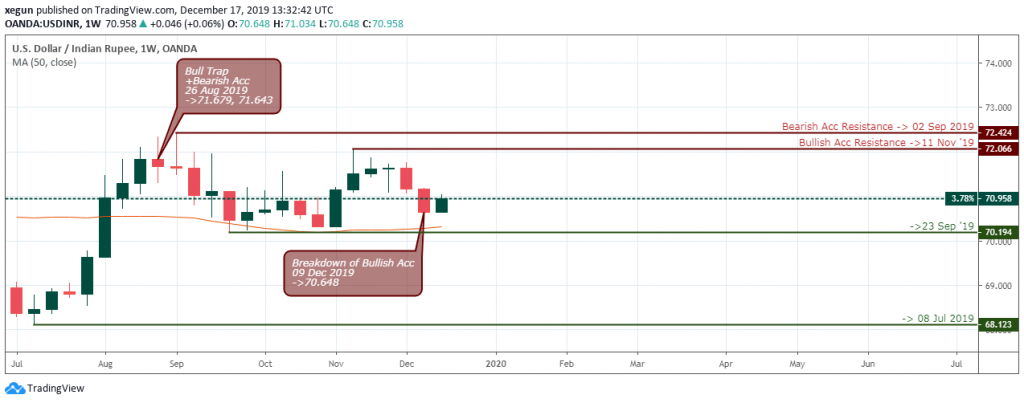
A bull trap price pattern on Aug 26 ’19, corrected the USD gains towards the 50-weekly Moving Average and has not been able to force a close below it, implying that the Greenback still has a stronger hold on the exchange rate.
The USDINR moves towards the MA-50 for the third time since it first touched it on Sep 23 ’19, and attempts to rally back to the upside after a collapse of double bullish support on Dec 09 ’19 (70.648).
A price close below the MA-50 would change the market outlook from bullish to bearish.
USDINR Medium Term Projections: Bearish
Daily Chart

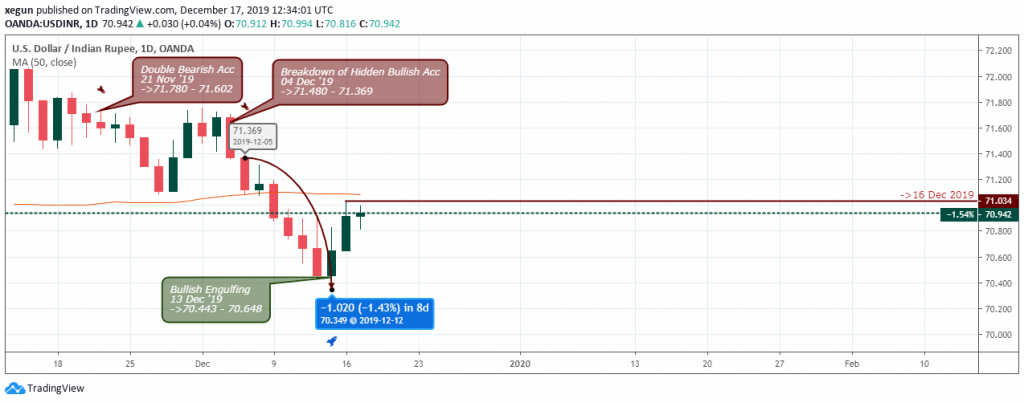
The daily time frame above illustrates the current bearish scenario on the USDINR and the possible end of the price drop or a continuation.
A bullish engulfing pattern on Dec 13 ’19 at (70.443 – 70.648) support sets the ball rolling for a price surge to the upside.
An impending accumulation of buy power at press time hint that we may be seeing an increase in the price of the Indian Rupee to the USD.
4HR Chart

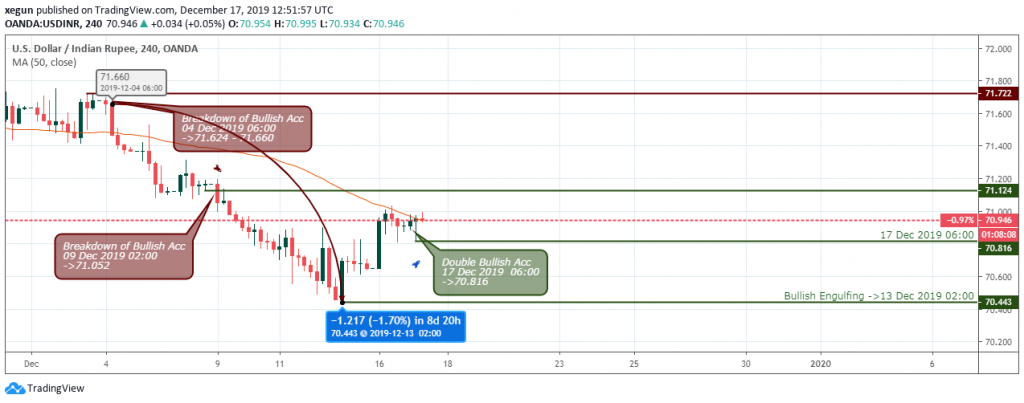
We round up our analysis on the 4hour time frame where the USD/INR surge above the MA-50 at publication time after a price dip of about (-1.70%).
The pair is held back (resistance) by the MA-200 at press time, indicating a possible range market or a bounce-back in the bearish direction.
Conclusion and Projection
Moving ahead, with the MA-200 serving as resistance on the 4hour time frame, we expect a mid-term slump in the price of the USD/INR.
A price close above the 71.217 resistance will confirm a continuation of the bullish recovery.

No Comments found