USD/INR – Weekly Outlook for August 22 2019
USDINR Forecast & Technical Analysis
Introduction
The Indian Rupee as revealed on IQOption broker has been losing to the dollar for five weeks in a row, owing to adverse macroeconomic events, and technical chart and price patterns for gatekeeping. Let’s take a closer look into activities for this week.
India’s Fundamentals
India foreign Reserve (USD)
The forex or foreign exchange (fx) reserve of a country can be employed to intervene in the fx market to establish the exchange rate.
The international reserve of countries is used to resolve the balance of payments insufficiencies within states. It comprises gold, foreign currency assets, particular drawing rights holdings, and reserve status in the IMF. The reserves also include other assets named in foreign currencies, and some fixed amount of Special drawing rights (SDRs).
The International reserve of countries serves as a useful precaution for nations susceptible to financial crises.
A reading that is higher than expected signals a positive/bullish sentiment for the INR, while a reading lower than expected suggests a negative/bearish trend for the INR.
Following the latest data released on August 16, previous data was 428.95B, while actual reading was pegged at 430.57B, suggesting a bullish trend for the INR.
United States Fundamentals
Crude Oil Inventories
The EIA Crude Oil Inventories gauged the hebdomadal variation in a commercial quantity of crude oil barrel figures and owned by U.S. firms.
The strength of inventories affects the price of petroleum products, which can indirectly influence inflation.
A higher than anticipated increase in crude inventories suggests a lesser demand, meaning a negative trend for oil prices. A lower than expected drop in inventories implies a bearish trend for the currency.
However, a less than anticipated rise in crude records implies higher demand, and this is positive for oil prices. A more than anticipated drop in inventories also shows an optimistic inclination for oil prices.
Most recent data released August 14 shows actual reading at 1.580M, previous reading at 2.385M, and the forecast at -2.775m. These indicators suggest a bullish sentiment for the USD.
USDINR Technical Analysis
USDINR Long term Projection: Bullish Swing
USDINR: Monthly Chart

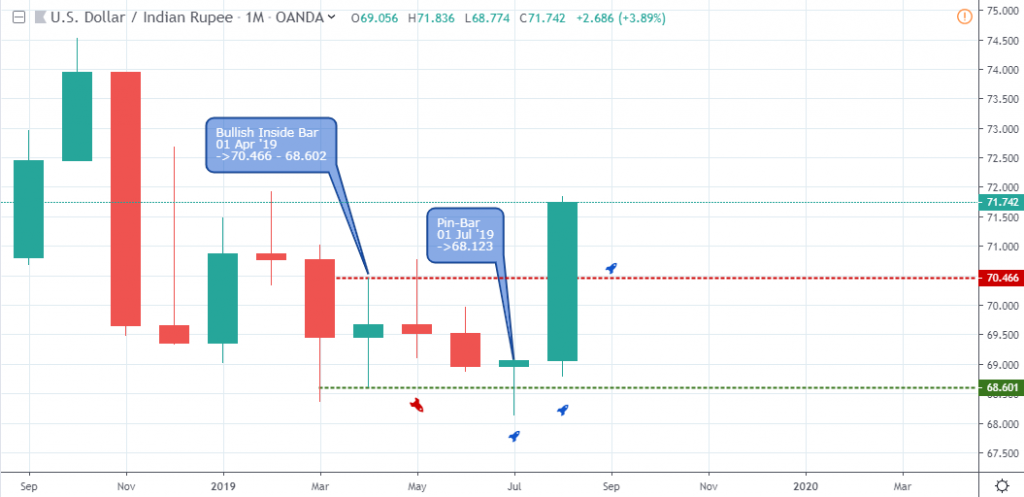
After a long bearish candlestick on November 01 ’18, the monthly time frame lost momentum as the price couldn’t break below the hidden bullish inside bar on April 01 ’19.
The bullish pin-bar candlestick pattern signaled on July 01 on the 68.601 support level suggested bullish sentiment as the USD to INR exchange rate trades above the 70.466 resistance.
USDINR: Weekly Chart

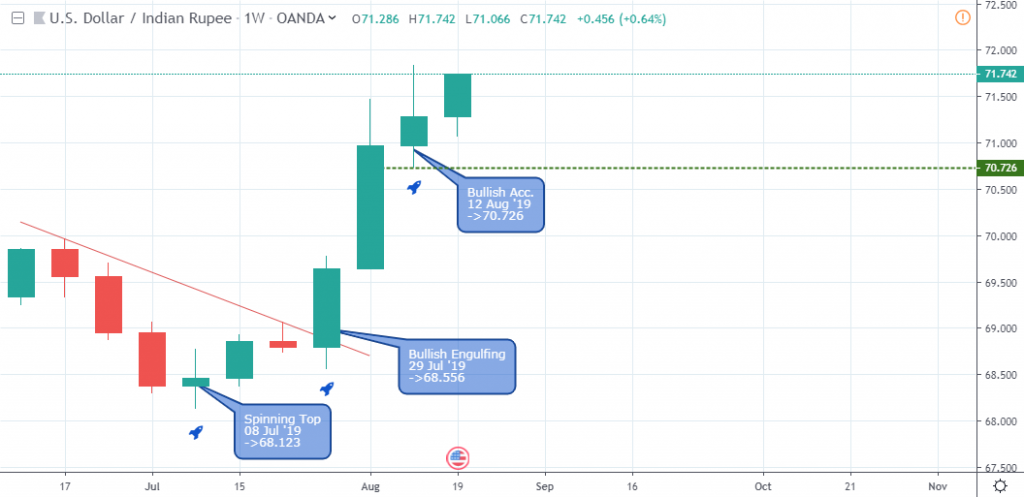
An increase in bearish sentiment towards the Indian Rupee was initialized by a breakout of the bearish trend line on July 29 ’19 following an earlier spinning-top candlestick pattern on July 08 ’19 (68.123). From the point of breakout, the Indian Rupee continues to show a bearish outlook with last week candlestick of the USDINR closing showing accumulation of bulls.
USDSGD Medium Term Projections: Overbought
USDINR Daily Chart

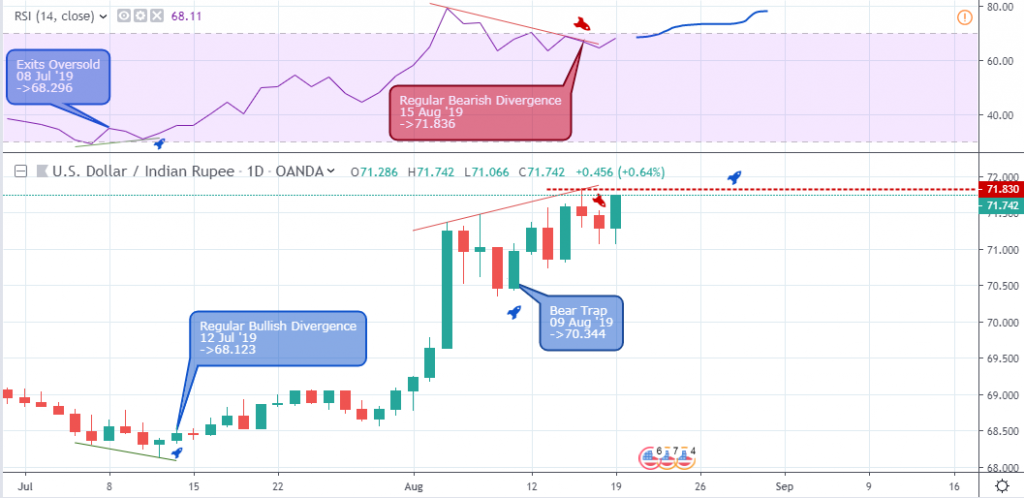
The regular bullish divergence pattern signaled on July 12 sets support at 68.123 after the USDINR exits the oversold area on July 08 ’19. This chart pattern was the significant catalyst that set the ball rolling for the current bullish trend we’ve seen for the five weeks.
Recently, as the USDINR exits the overbought territory, a regular bearish divergence is flagged, showing possible correction of the USD gains.
We should expect a continuation of the bullish trend and an end to the bearish divergence if the price close above the 71.83 resistance, as the price chart continues to form higher lows.
USDINR 4HR Chart

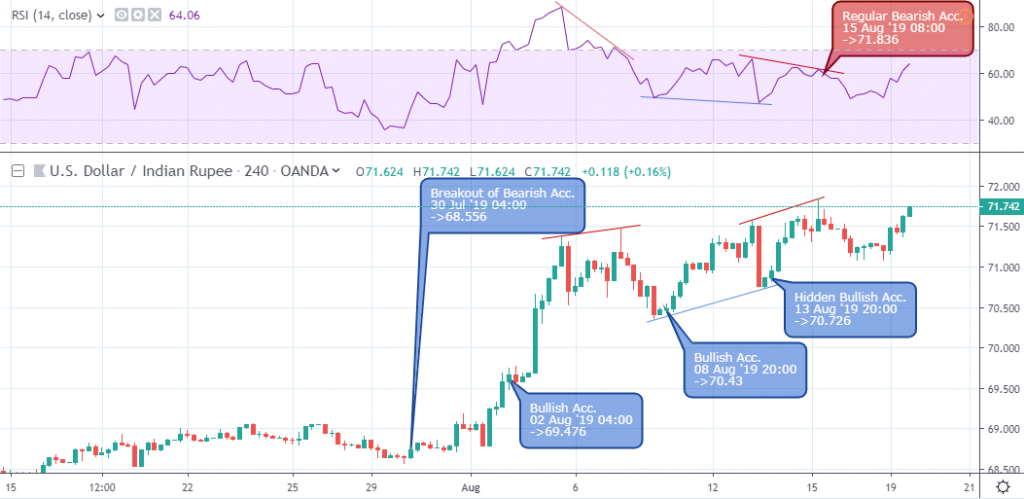
Buying pressure persists in the face of regular bearish divergence patterns on August 07 12:00 and 15 12:00. The earlier price rally was triggered by a failure of resistance on July 30 04:00 for a price increase of about 4.4%.
Conclusion and Projection
Although the USDINR maintains a bullish outlook on both the long and mid-term trends, a collapse of the rising low (49.40) may switch the mid-term trend to the bearish direction, while the long term trend may experience a price correction.

No Comments found