Bitcoin to USD ( BTCUSD ) Weekly Outlook , August 13 2019
BTCUSD Forecast and Technical Analysis & Fundamentals for Bitcoin
Introduction
Two weeks ago, the Bitcoin price broke out of a weekly bearish inside bar price pattern ($10686.89), while at the same time triggering a hidden bullish divergence pattern after a five weeks retracement of a bullish trend.
A recent bearish plunge in the bitcoin price shows that it may not be smooth sailing to the top. This week we analyze the technical chart, price patterns, and exciting news driving the Bitcoin price on top crypto platforms such as Olymp Trade.
Bitcoin to USD Technical Analysis
BTCUSD: Daily Chart

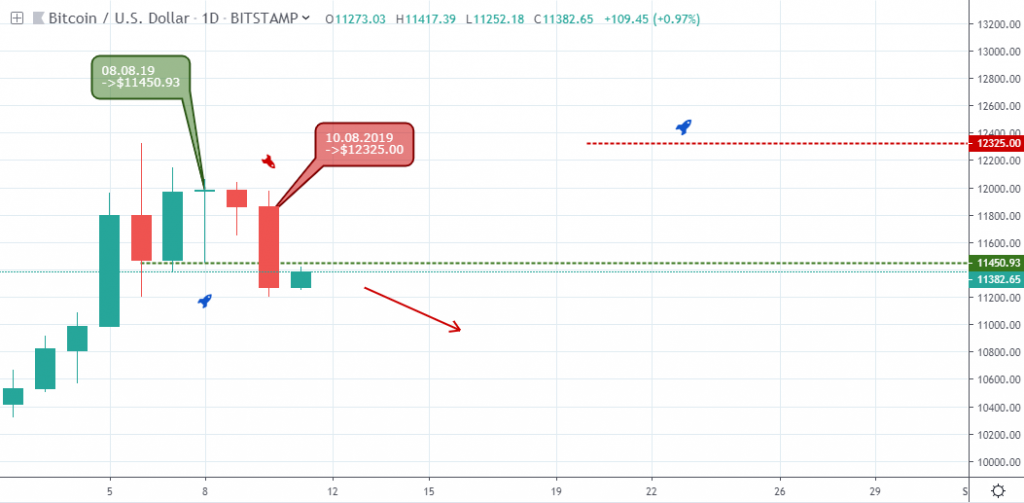
Hovering below the RSI overbought level-70, the Bitcoin price signal accumulation of bulls on August 08 ‘19.
Considering the pattern was formed at the peak of a bullish rally, the bears crashed below the support registering a 4.94% price decline on major Bitcoin broker platforms (August 10 ’19).
However, the July 10 ’19 resistance now a support level ($11120.00) serves as a springboard for the sudden price plunge on August 11 ‘19. A price breach of this level will mean the price correction is not over.
BTCUSD: 4Hour Chart

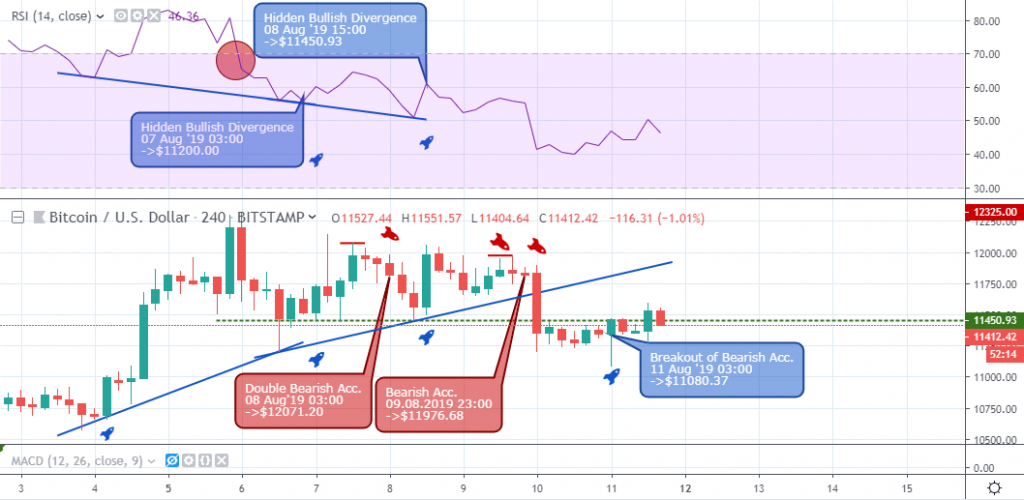
From the above 4hour time frame illustration, we notice how the BTC price made an early rally on August 04 ’19 07:00 for about 12.0% increase in price. Upon exiting the overbought level on August 06 ’19 03:00, the pair started forming lower highs on August 07 07:00 ($12145.42), August 08 15:00 ($12061.10), and August 09 19:00 ($11976.68).
The bullish trend lines established by the hidden bullish divergence patterns on August 07 and 08 finally gave in to an increase in selling pressure on August 10 ’19 03:00.
A breakout of bearish resistance ($11366.74) at the nineteenth hour of August 10 hints a possible bullish recovery of the Bitcoin price.
Let’s move one more step lower to the two-hour time frame for an intraday perspective of the price dynamics.
BTCUSD: 2Hour Chart

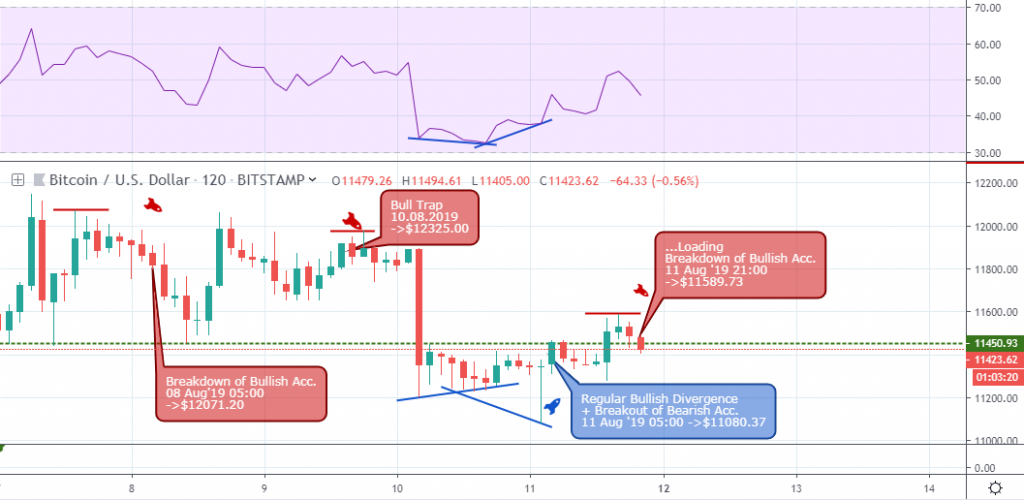
Increase in selling pressure on August 08 and 10 is displayed as a breakdown of bullish supports ($11842.00 and $11859.32).
After the price decline on August 10, the bulls start breaking through intraday resistance levels of $11397.98, $11365.97, and $11424.26 respectively.
Bitcoin Fundamentals
Fidelity Center for Applied Technology affiliates with Blockstream’s New Bitcoin Mining Service
Blockstream, a blockchain-tech company, recently published features of its services in mining Bitcoin BTC. In a blog post on August 08, the company unveiled two large data centers for enterprise-class co-location services utilizing the BetterHash protocol.
The BetterHash protocol reportedly allows individual miners to control transactions included in their newly mined blocks leading to increased decentralization and reduction in the likelihood of possible attacks against the network.
The service, aimed at enterprise and institutional customers, has attracted the Fidelity Center for Applied Technology as an early customer.
Located in Georgia and Quebec, the centers aim to sustain the decentralization of the Bitcoin (BTC) network. The data centers combined contribute up to 300 megawatts of energy capacity and at full capacity account for approximately 7.5% of the hashrate of the entire network.
The facilities provide a turnkey solution for co-location of customers’ mining tools. The facilities also provide installation and maintenance, and delivery of mining equipment to the data-center. The customer remotely manages the mining rigs giving them real-time analytics and control over each device’s operation.
Conclusion and Projection
A break below the bullish support ($11468.49) indicates a comeback of sellers and possible continuation of the earlier price plunge on August 10.
No Comments found