USDINR – Weekly Outlook for April 12019
USDINR : Weekly Technical Analysis for Forex Brokers
Introduction
The latter part of Q1 ’19 proved favorable for the USD paired against the Indian Rupee as we see a series of consecutive bullish closing bars. Entering Q2 ’19, the Rupee tried to regain its strength. However, it couldn’t stand the test of time. Join as we look at the critical technical patterns as well as fundamental indicators driving the price of the USDINR and possible trend projections.
India’s Fundamentals
M3 Money Supply
The Reserve Bank of India issued the decision for the M3 Money Supply which is a measure of all the Indian Rupees in circulation, including money held in bank accounts, note, and coins. The M3 money supply is recognized as a significant pointer to inflation since financial increase adds weight to exchange rates. An increase in the M3 money indicates a bullish outlook for the Indian Rupee, while a slump shows bearish outlook for the Rupee.
The real value came out 10.6%, which is equal to the former result.
India’s Trade Deficit
India’s Ministry of Commerce and Industry released the trade deficit on Thursday 11 April ’19, which is a figure that compares the number of imports to exports of total goods and services. A positive assessment reveals a shortfall in trade, while a negative value reveals an excess of trade. Steady growth in demand for Indian export is regarded as negative for the trade deficit and consequently positive for the Indian Rupee. The previous reading is at $9.6B while the consensus is at -$10.3B.
India’s FX Reserves in USD
The Reserve Bank of India will on Friday 12 April ’19, release the FX Reserve data, which shows variations in the value of official reserve assets revealing sales and purchases by the CBN. The previous value was $411.91B, and a greater reading is viewed as bullish for the Indian Rupee, a low interpretation is seen as negative for the Rupee.
United States Fundamentals
US New Home Sales
The Michigan Consumer Sentiment Index
The University of Michigan will on Friday 12 04 ’19 release a survey of personal consumer confidence in economic activity. It paints a perspective of consumers that are willing to spend money. A high reading generally highlights a bullish USD, a negative reading, on the contrary, shows a bearish USD. The previously released value was at 98.4, as opposed to the consensus at 98.0.
Technical Analysis
USDINR Monthly Chart

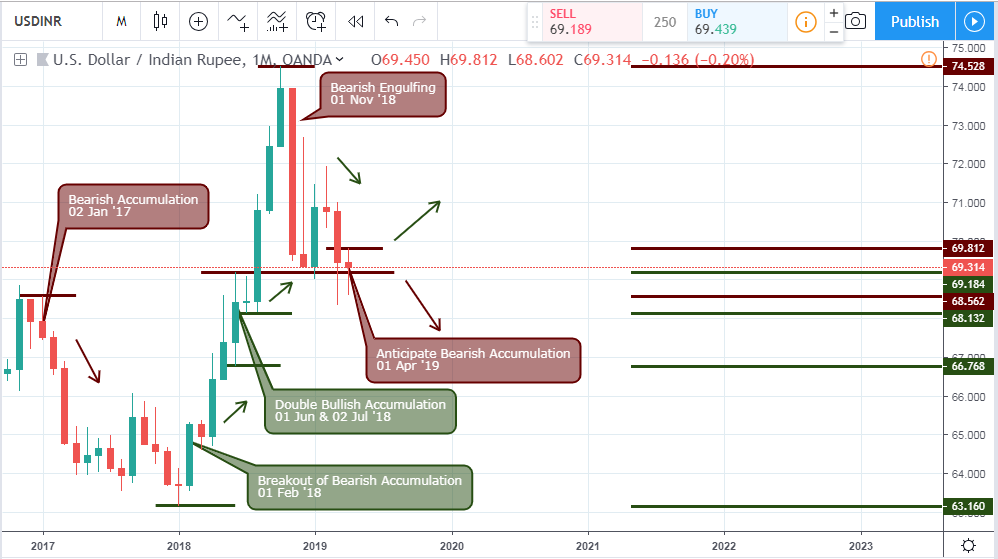
The breakout of bearish pressure on February ’18 triggered a bullish trend that lasts about nine months after which the pair failed to a bearish engulfing pattern on November 2018. The pair currently sits on the previous resistance level established by a double bullish accumulation pattern signaled on 01 June and 02 July ’18. This represents a change in polarity, considering that the pair threatens to form a bearish accumulation pattern.
USDINR: Weekly Chart

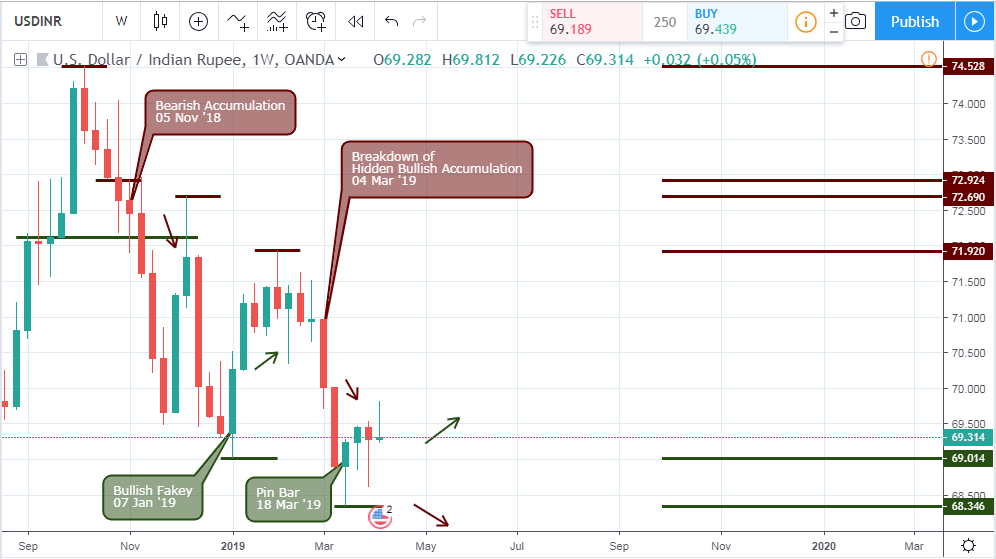
Looking at the above weekly chart, we’ll observe that the series of bearish closing candles eased into deep oscillatory swings, a sign that the trend state has moved a step higher above the monthly chart. The price of Indian Rupee crashes below the bullish Fakey support at 69.014. A pin bar pattern is signaled on 18 March ’19 with support at 68.346.
USDINR Daily Chart

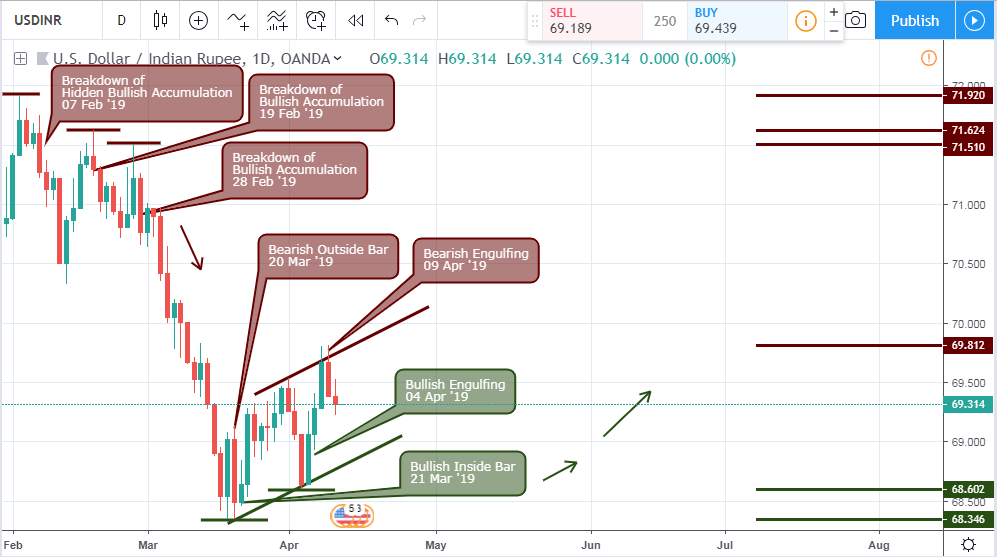
The bearish trend shown above started from a collapse of hidden bullish pressure pattern on 07 Feb ’19 and further reinforced on 19 & 28 February ’19 resulting to a 4.12% price decline.
Conclusion and Projection
As the USDINR sits on the previous resistant level, we anticipate a trend reversal back to the upside in favor of the USD. However, a price .close below the above mentioned monthly support will indicate a continuation of the bearish trend in favor of the Indian Rupee.
Visit the broker section of our website for a list of top brokers, such as OlympTrade, to execute your long and short orders with great user experience.

No Comments found