Bitcoin to USD ( BTCUSD ) Weekly Outlook , March 21 2019
BTCUSD Forecast: Technical Analysis & Fundamentals
Introduction
Speculative adoption is on the increase in the cryptocurrency market as the Bitcoin price scores a fourth bullish closing week on most India brokers and crypto platforms. In a recent CNBC interview with FUNDSTRATS Tom Lee, he projects a period of five to six month for a confirmed bullish trend. Come along as we dive deeper into some more interesting fundamental and technical events driving the price of the crypto giant.
BTCUSD: Daily Chart

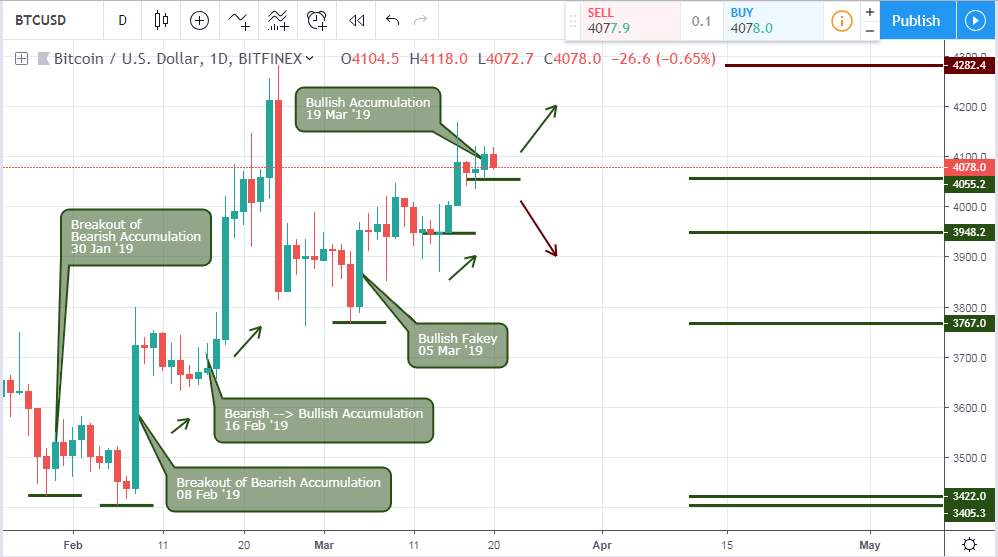
We see a rise in investor sentiment as the BTCUSD breaks out of bearish price congestion on 30 January, followed by another breakout on 08 February, this time with higher volatility.
Bitcoin price from these points rose by 14% and 21%, with established supports at 3422.0 and 3405.3.
The signal transition from bearish to bullish on 16 February forced a price increase of 14.5% before a price plummets from a dark cloud cover price pattern.
A correction of weekly trend move was triggered by a bullish fakey pattern, leading to a bullish price close on the weekly chart.
Bitcoin Fundamentals
Regulatory Adoption
Former Chairman of CFTC: A call for Better Regulation of Cryptocurrencies
Recently in the news, a fellow of Harvard University and former CFTC chairman Timothy Massad in a report for the Brookings Institution, calls for a strengthening of cryptocurrency regulations. The report approaches the need for thorough regulation of crypto-assets, increasing investor protection as well as reducing cyber-attacks.
Mainstream Adoption: Swiss online Retailer Accepts payment with Cryptocurrencies
On 19 March, Digitec Galaxus, an online retailer in Switzerland announced the inclusion of cryptocurrencies as alternative payment methods made available to its customers. The retailer at the moment accept payments using Bitcoin (BTC), Ethereum (ETH), Ripple (XRP), Bitcoin Cash (BCH), Litecoin (LTC), Binance Coin (BNB), Tron (TRX),OmiseGO (OMG), NEO (NEO) and Bitcoin SV (BSV).
This project was in collaboration Datatrans, a Swiss payment processor, and Coinify a Danish crypto startup.
Technical Analysis
BTC/USD: 4-HR Chart

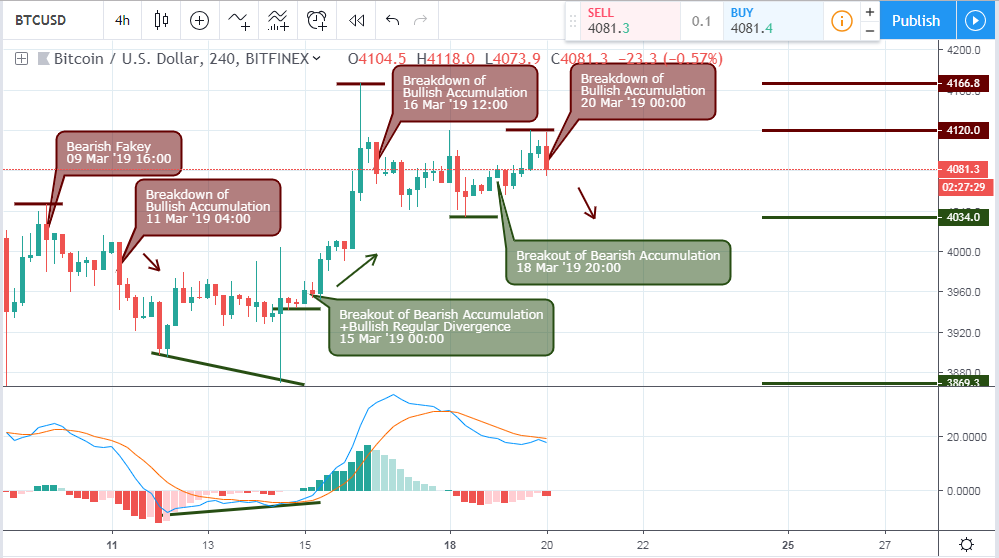
Citing the 4hour bars, you’ll observe that the pair is in deep bearish and bullish oscillations. Beginning with a bearish fakey on 09 March 16:00, followed by a breakdown of bullish pressure on 11 Mar 04:00. Sellers pushed the price south for a 3.11% retracement.
Moving forward to 15 March 00:00, the price breaks out of a bearish pressure with a 5.15% bullish rise.
The bears are beginning to show an increase in strength as bullish pressures collapse to bearish closing bars on 16 March 12:00 and 20 March 00:00.
Conclusion and Projection
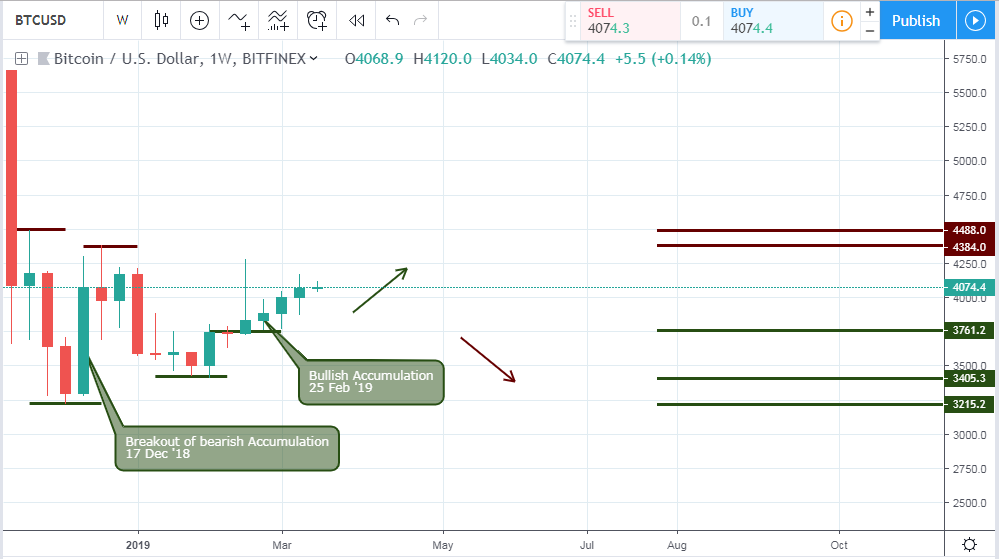
On Binomo trading platform, the bitcoin price has maintained consecutive bullish closing bars on the weekly time frame as shown below. The price move which started by a bullish accumulation pattern established a higher support level at 3761.3 above the previous 3405.3 and 3215.2 area.
A bullish price close above the 4384.0 resistance at the end of the month will confirm the long expected bottoming and end to the crypto winter. On the other hand, a failure of the 3761.2 support will spell doom for HODLERs.
BTCUSD Weekly


No Comments found