Bitcoin to USD ( BTCUSD ) Weekly Outlook , January 23 2018
Technical Analysis & Weekly Forecast for Bitcoin Brokers
Introduction
Following an increase in regulatory adoption and recent news on the vulnerability of some Bitcoin wallets, the Bitcoin price still maintains a bearish sentiment on the higher leading monthly time frame. However, the lower daily and 4hour charts do offer quick scalping trades. Read on as we analyze the fundamental and technical events at play for the week.
BTCUSD: Monthly Chart

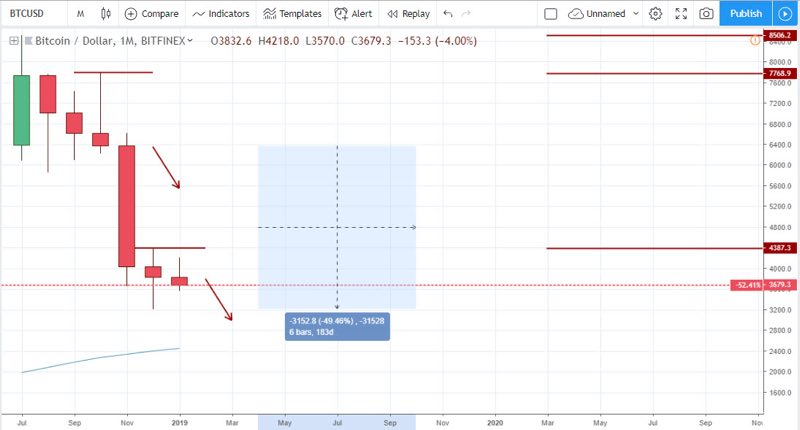
The monthly chart of the BTCUSD still trading below the bearish accumulation resistance of 4387.3 and maintains a bearish outlook. A bearish price close within the 4384.0 and 3215.2 range will trigger a double bearish accumulation pattern and further price decline towards the MA-65 currently at 2459.1.
Bitcoin: Previous Events
Bitcoin (BTC) Crypto Finance Conference and Cboe XBT Expiration Date16 January 2019
Sterling Witzke a partner at the Winklevoss Capital maintained an opinion at the crypto finance conference last week that cryptocurrencies may not get the expected attention of institutional investors in 2019. She hinged her position on security concerns and a lack of regulatory clarity, especially in the United States.
The Bitcoin Future Contract (XBT/F9) Cboe XBT expiration date was another important event that was worth noticing last week as the BTCUSD closed bullish, indicating presence of bulls on 17 January.
Bitcoin Fundamentals
Upcoming Events
The daily time frame currently signals a breakout of bearish accumulation, offering short term long entry which is best suited for binary options trading. We will not recommend this for long term holding as the higher time frames still maintain a negative outlook to the Bitcoin price. The MA-65 may be a good profit target for such ambitious buy trade.
Bitcoin: This Weeks’ Upcoming Events
The above weekly chart clarifies a long-awaited breakdown of hidden bullish accumulation. This indicates further short selling as the pair also recently triggers a bearish accumulation after the closing price of 14 Jan ’19. Further price close below the 3215.1 bullish accumulation support will boost selling confidence.
Bitcoin (BTC) Unconfiscatable Conference and Bakkt Launch
24 January 2019
Taking place at The D Hotel, Las Vegas tomorrow is the Tone Vays’ Unconfiscatable Bitcoin and not Blockchain conference. On the same day, we will witness the launch of Bakkt exchange which is expected to generate an increase in demand for bitcoin from Bitcoin brokers.
Bitcoin (BTC) CME: January Last Trade 25 January 2019
An important event that can give clues on the direction of Bitcoin trend in the coming month January, 25 is the last trade date of Bitcoin futures contract, with trading terminating at 4 PM GMT. Already, the month of December 2018 closed, triggering bearish accumulation pattern. A buildup of the same pattern is in view, and we may see a further increase in selling pressure.
Technical Analysis
BTC/USD: 4-HR Chart

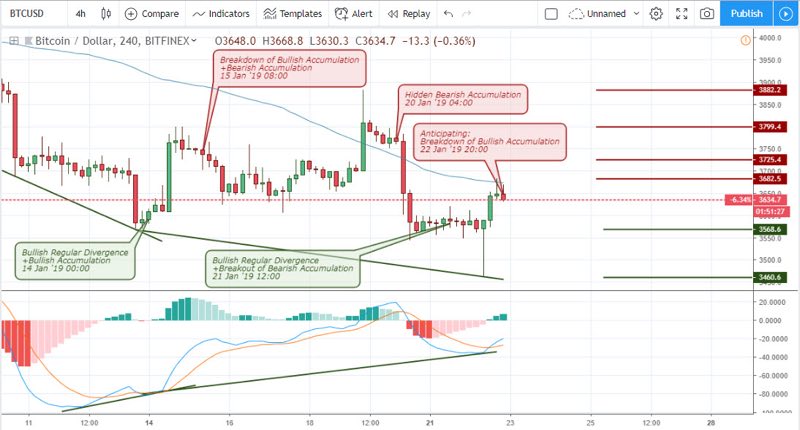
On major bitcoin brokers, such as IQ Option India , the 4hour chart triggers bullish regular divergence on January 14 ’19 00:00 and January 21 ’19 12:00. This time frame as mentioned in the introduction is suitable for short term holding trades, starting with a breakdown of bullish accumulation on January 15 ’19 08:00 and a hidden bearish accumulation on January 20 ’19 04:00, both respectively yielding a profit of 3.5% and 8.0% from short sell trades.
Conclusion and Projection
Short term long entry trades from the divergence patterns on the 4hour chart and breakout of bullish accumulation on the daily chart offer potentially strong bullish sentiment. However, we are more on the lookout for convergence of technical patterns for short entries.

No Comments found