USD/INR – Weekly Outlook ( January 3 2018 )
USD / INR : Weekly Technical Analysis for Forex Brokers
Introduction
Towards the end of the Year 2018, exchange rates of the Indian Rupee saw a substantial recovery in strength as the USDINR plunged by 3.5% after the bearish accumulation signaled midway into December 2018. The release of important fundamental events for the U.S and India may lead to a change of trend direction. Find out more as we take a look at such technical and fundamental events this week.
India’s Fundamentals
M3 Money

The Reserve Bank of India released the M3 Money Supply which is a measure of all the India Rupees in circulation. This includes coins, notes, and funds secured in bank accounts. This is viewed as a main indicator of inflation, considering that monetary expansion adds weight to the exchange rates. A rising of the M3 money is considered good for the Rupee, whereas a slump is seen as bad.
From the chart history of the M3 money, the result plateaued throughout the year 2018 after a surge in 2017. The current results for this week came out 10.2% compared to the 10.5% from the previous result.
United States Fundamentals
United States: Markit PMI

Manufacturing PMI, a leading and key indicator, as well as an important driver of the GDP, was released this week. Values above 50 signify an expansion of the economy as viewed from our scorecard, a contraction of the economy is anticipated as values go below 50 points showing a negative weighting on the USD. The actual result came out 53.8 which is lower than the previous 53.9. This indicates a rising but slowing economy.
Technical Analysis
USDINR: Weekly Chart

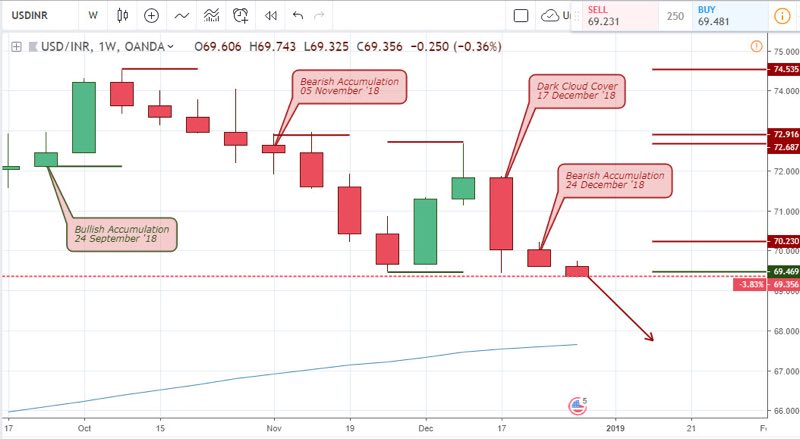
Following the bullish price close of the USDINR pair in October, price quickly entered into a series of bearish closing bars and bearish accumulation on November 5 2018. A bullish engulfing pattern on December 3 2018, triggered a slowing of eh strength of the Indian Rupee. However, after a bearish closing week of December 17 2018, price closed forming a bearish accumulation pattern on December 24 2018.
USDINR Daily Chart

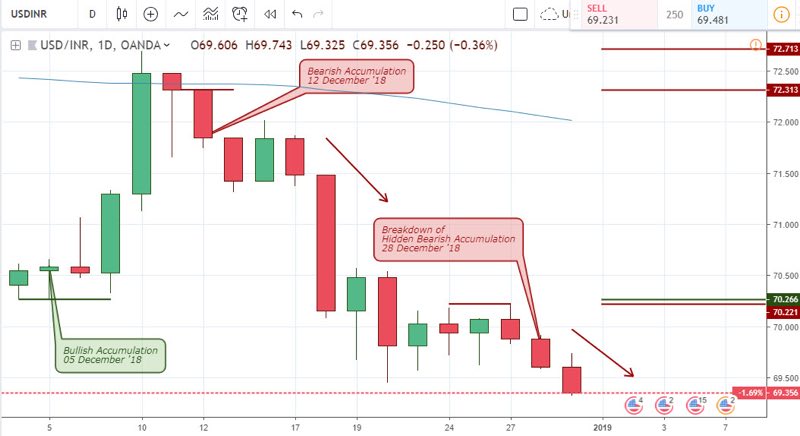
The bearish closing bar of the 17 December week, was triggered by the formation of a bearish accumulation on December 12 2018 from a daily chart perspective. This bearish signal established a resistance level at 72.313, leading to a 3.25% price drop.
USDINR 4-Hour (H4) Chart
Similar to the daily chart, the 4hour chart also highlights the bearish sentiments of the market, but more with in a sequence of breakdown of bullish accumulation on December 17, followed by a combination of bearish accumulation and breakdown of a double bullish accumulation on the December 18 as shown above.
A sudden surge in volatility in favor of the USD was experienced today, triggering a bullish regular divergence patter upon release of the United States PMI by the Markit economics. Update to the 4hr chart is below.
UPDATE: USDINR 4-Hour (H4) Chart
USDINR 2HR Chart
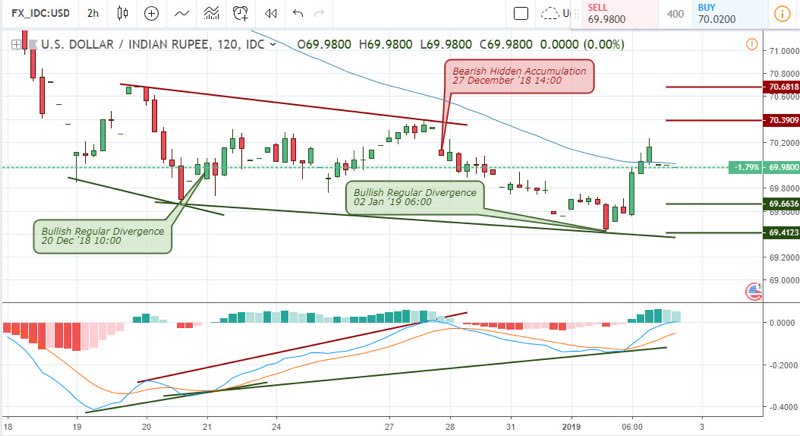
The above 2hour chart shows a breakdown of bullish accumulation on December 27 2018 14:00, followed by a bearish accumulation pattern on December 28 201810:00.
UPDATE: USDINR 2HR Chart

The above 2hour chart is an update highlighting the bearish accumulation patterns triggered on December 20 ’18 10:00; December 27 ’18 14:00; and the most recent one triggered on January 2 ’19 06:00. This indicates a possible buildup of strength of the U.S economy.
Conclusion and Projection
Entering into the first week of the New Year 2019, we suddenly see an upward surge in the price of USDINR signaling a strong U.S dollar. For now, the USDINR pair still maintains a long term bearish sentiment. However, a bullish price close above the bearish accumulation resistance from the weekly chart at 70.230 will be a total game changer and a switch to a bullish trend.
You may want to visit the brokers section of our website for a list of regulated forex brokers to trade the USDINR pair, as well as other currency pairs
Happy New Year!
Top 3 India Forex Brokers to trade Indian Rupee.


No Comments found