Bitcoin to USD ( BTCUSD ) Forecast & Weekly Analysis, July 31 2018
BTCUSD Weekly Forecast & Analysis for Crypto Brokers
Introduction
So far so good, Bitcoin is bent on holding its grounds against the dollar as this week is flooded with positive sentiments, especially as the SEC rejected the Winklevoss twins ETF application.
Speculative Demand
Finally, there is hope for Indian residents looking out for crypto brokers, as Huobi’s OTC trading platform now supports transactions in Indian Rupees. Huobi using their over the counter service has made a move to offer zero-fee trading of Bitcoin, Ethereum, and Tether using the Indian Rupees.
Blockchain Adoption
The company CLS, who happens to be an FX settlement provider, has been collaborating with IBM to finally bring block-chain powered payment services. They are currently at the beginning of the final testing for Blockchain payment banking services for banks.
Regulatory and Security Adoption
This week in the news is a proposal for responsible crypto market growth by the Chamber of Digital Commerce. They proposed a document titled “Understanding Digital Tokens: Market Overview & Guidelines for Policymakers & Practitioners.
Technical Analysis
Following a top-down approach to the analysis of time series is often the best way to go. The best scenario we look out for during such analysis is the associative nature of the time frames, where they follow a harmonious direction. Without further ado, let’s start with the Monthly chart and transition way down to the 2hourly chart.
BTCUSD: Monthly Chart
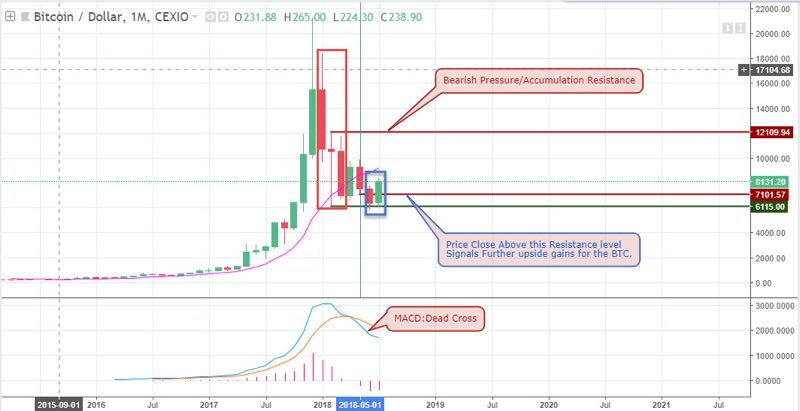
Starting from the monthly chart, we can see that the pair established huge sell pressure from the beginning of the year, however, in the current month of July, the pair is hanging on to the $8000 mark. Although the price has not yet closed, this idea transitions into consecutive weekly bars in the next segment.
BTCUSD: Weekly Chart
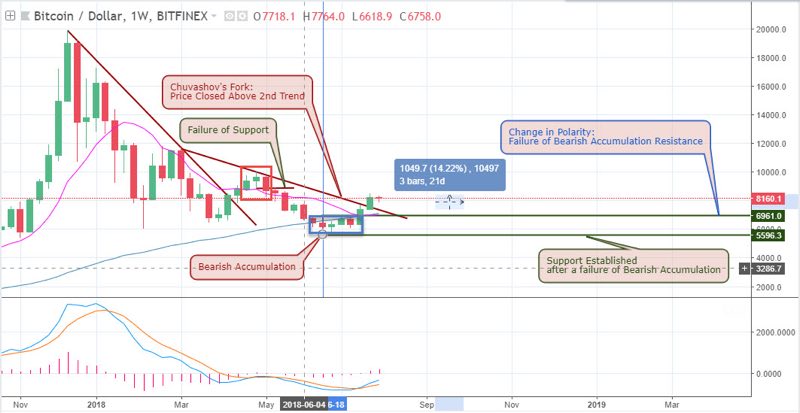
As mentioned on the monthly perspective, we have price breaking out of a low bearish accumulation phase on the 18-06-2018. This break out already has presented 2 consecutive bullish bars already on the weekly chart. Again looking at the chart above, we mentioned last week that if a price close above the second trend line of the Chuvashov’s fork is established, we should expect further bullish take over. Well, it’s happening, price closed above the trend line and from this point, we are looking out for more strength in the Bitcoin to USD exchange rate.
BTCUSD: Daily Chart
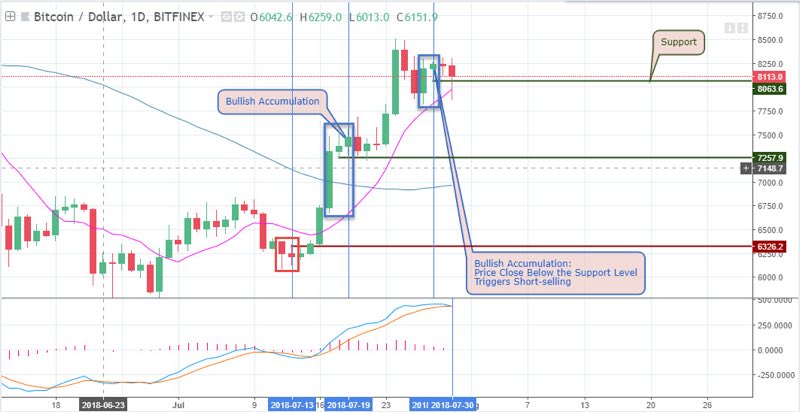
The BTCUSD really aligns with the associative correlation of timeframes we look out for. First is a single Monthly bar; followed by consecutive weekly bars; next is the daily chart showing compact but clearly spelt out the trend. We can observe clear corrections in the form of bullish accumulation or failure of bearish accumulation patterns towards the upside. Here is where we get a good picture of how this week will turn out.
The pair is currently in a retracement showing bullish accumulation of price. With this formation in place, we expect the price of Bitcoin on all crypto brokers to trade towards the $9000 mark, moving forward.
BTCUSD: 4-hour Chart
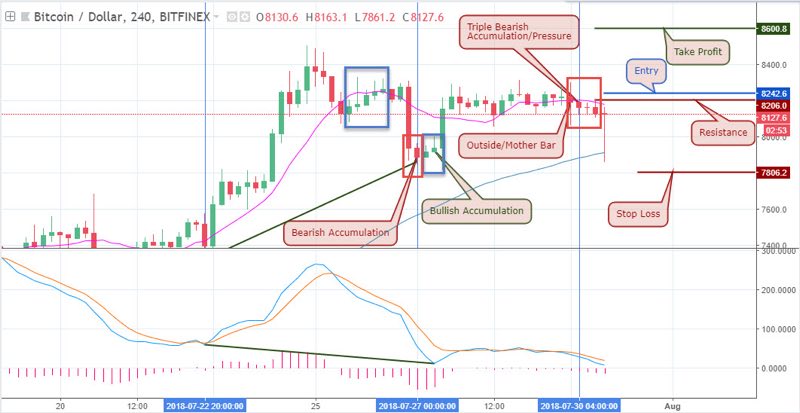
Although top-down analysis can be a bit exhausting, it is the best way to handle housekeeping when analyzing trading securities. Continuing with our idea, the 4hr chart displays more swings as shown above. Here we can easily set up entry prices to go long or Short. The bullish hidden divergence on the 4hr time horizon completely agrees with the bullish accumulation pattern on the daily chart. We can also observe the failure of bearish accumulation pattern which is later succeeded by a bullish accumulation pattern on the 27-07-2018.
BTCUSD: 2-hour Chart
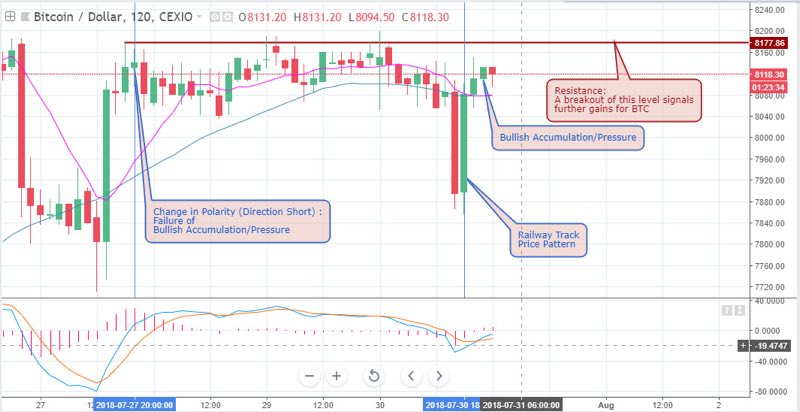
Railway track price action patterns are very strong continuation patterns especially when they are established in the same direction as a higher time frame trend, in this case, daily chart trend. We patiently wait for a price close above the above resistance level at 8177.86 for further BTC gains.
Conclusion and Projection
At the point of putting this article together, the pair established a bearish triple accumulation phase which we expect to fail towards the upside. We know jumping in at this point can be suicidal, and for this reason, we wait for the price to close above $8206.00 resistance.
Top 3 Crypto Brokers to trade Bitcoin to USD


No Comments found